Influencer marketing is one of the most prevalent and effective marketing techniques used across industries and social media channels. And, YouTube influencer marketing is no exception.
Despite the turmoil of the past twelve months, YouTube (which is primarily a video platform) has maintained its status as one of the most popular social media platforms (Instagram being the most popular). This popularity can be partly attributed to the growth of sponsored videos and influencer-brand partnerships on the channel.
It is, in fact, a popular social media platform for both B2C and B2B influencer marketing campaigns.
Understanding this success—staying on the top in a dynamic landscape—requires a deep dive, which is exactly what NeoReach did in their 2020 Year in Review report (also elaborated by Influencer Marketing Hub here.)
The report analyzes data from more than 31,000 YouTube videos and provides valuable insights for marketers. Each video considered for this YouTube influencer marketing study complied with the following best practices and guidelines:
- The brand collaboration was clearly indicated according to FTC regulations.
- All of these videos were posted in 2020.
- The sponsor was either a brand from the United States or Canada.
- Each video recorded 10K+ views at the time the data was collected.
Analyzing the data for the sponsored influencer campaigns of top-spending brands provided industry-leading insights into the continued success of YouTube influencer marketing.
The report also has relevant influencer marketing data from across industries, which helped provide a complete understanding of the current marketing landscape to marketers.
This post also uses insights from NeoReach’s Social Intelligence Insights report along with the YouTube influencer marketing report to create a comprehensive YouTube influencer marketing guide.
But, before we get into the findings of their YouTube influencer marketing report, let’s first understand the research methodology used and best practices followed.
Table of Contents
Research Methodology
They used over 20 million videos to compile the data in this YouTube influencer marketing report—a feat achieved by the Social Intelligence API of NeoReach.
These videos were filtered using the requirements mentioned above to ensure the statistics were relevant to the topic. This produced a data set of over 31K sponsored YouTube videos, including the ones from top-spending brands for YouTube influencer marketing in 2020.
To evaluate the cost and effectiveness (return on investment or ROI) of each influencer marketing campaign, NeoReach calculated the Influencer Media Value (IMV) metric. When combined with standard industry benchmarks, it can determine the ROI of influencer marketing campaigns.
These industry benchmarks are calculated from a collection of data from various marketing channels. These include performance-tracking analytics data from historical campaign performance, industry surveys, paid campaigns, and market reports.
It then compares the reach of sponsored video posts with these benchmarks to produce a specific value. This value shows the cost of generating equivalent engagement levels using a different type of paid media. Basically, it shows the value of your influencer campaign.
YouTube Influencer Marketing Report: Key Insights
Here are some of the key insights from the YouTube influencer marketing report:
Top Industries – By Spending on YouTube Influencer Marketing
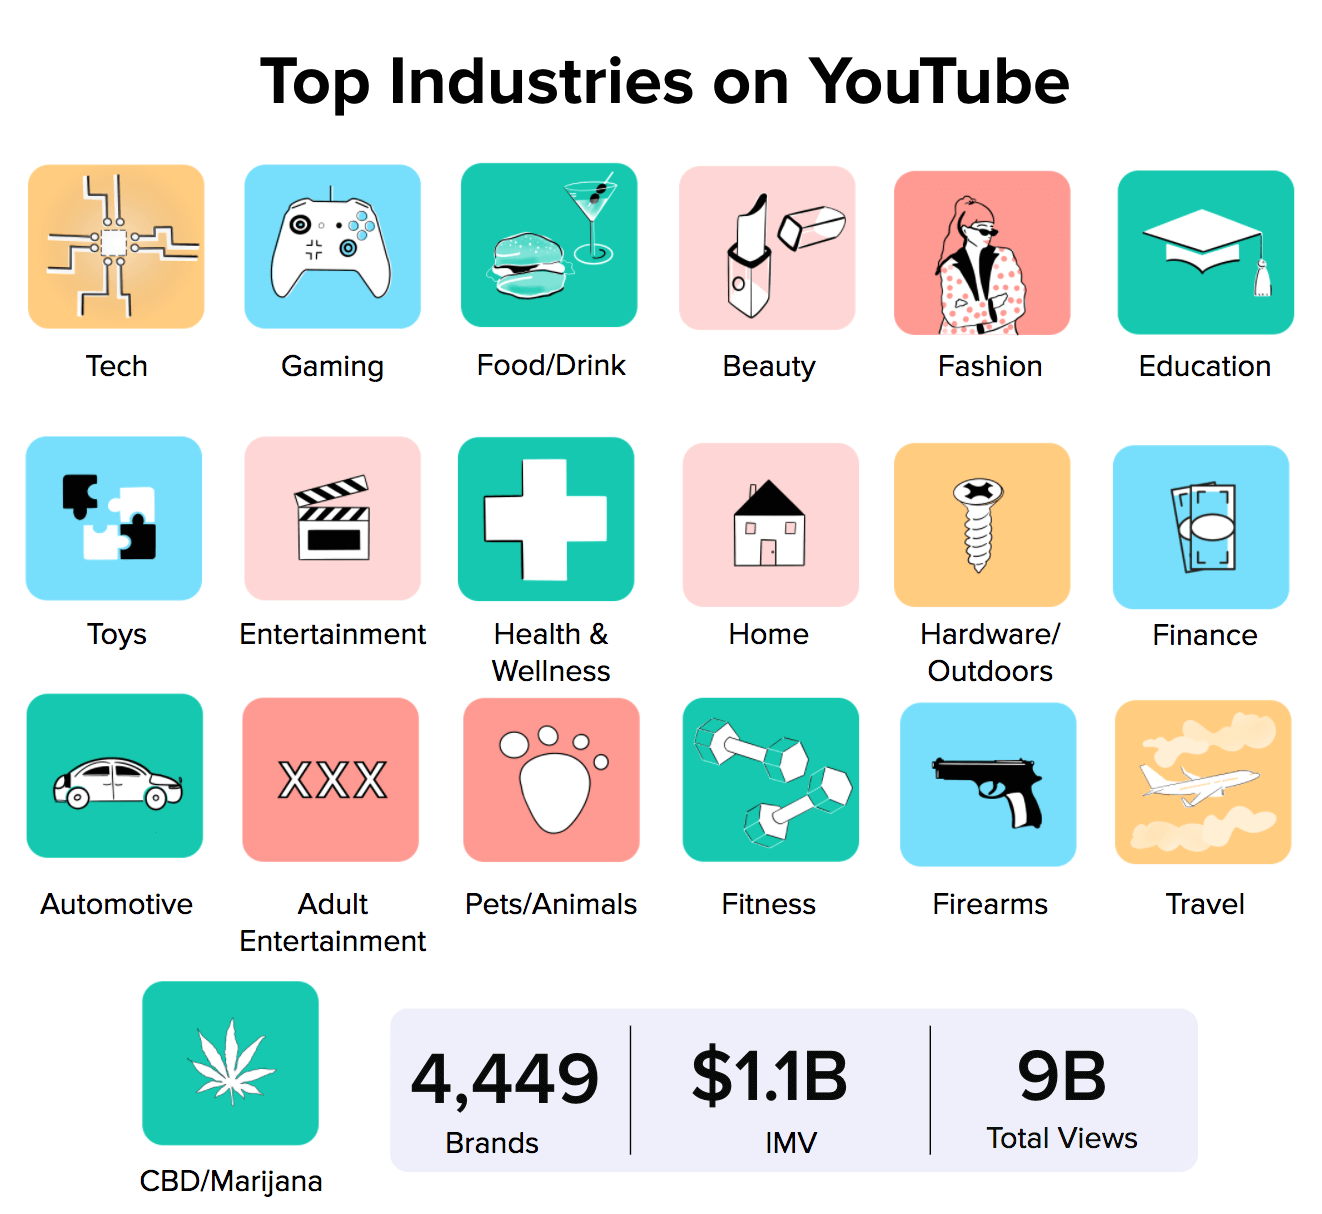
Approximately 4,500 brands paid for sponsored videos on YouTube in 2020 and worked with different creators and YouTube influencers to achieve different marketing goals.
All YouTube influencers and creators who worked for these brands used proper disclosure by using words like “advertisement,” “ad,” “sponsored content,” etc. in their video posts.
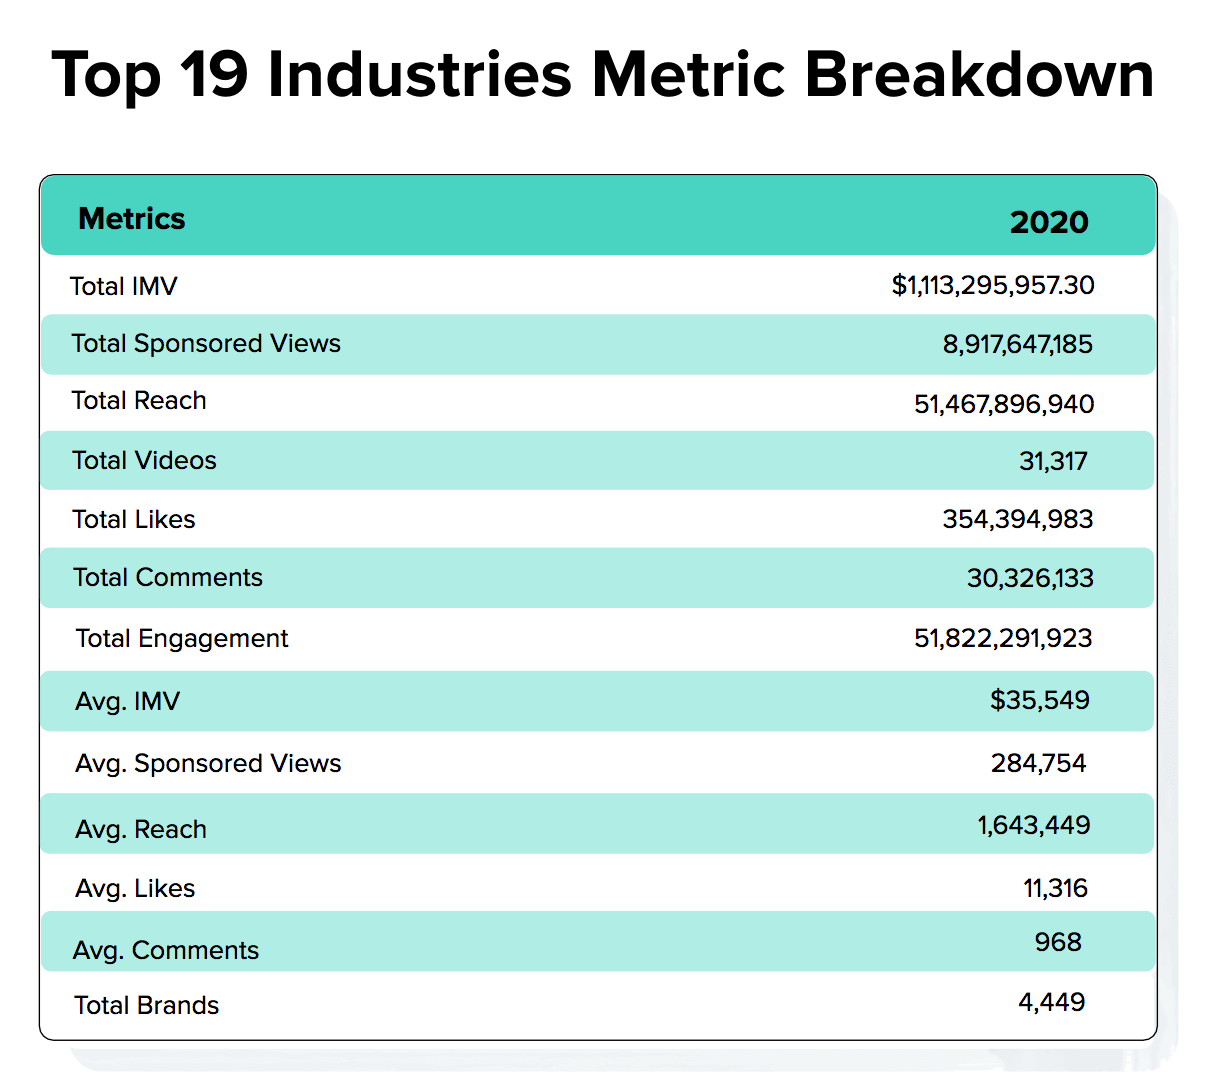
Top Industries – Key Metrics Breakdown
In the top 19 industries, brands spent ~$1.1B to garner ~9B views and reach 51.5B YouTubers. The tech, gaming, and food & drink industries were the top three spenders who collaborated with YouTube influencers for sponsored video campaigns.
Out of the 31K sponsored videos analyzed, total engagement was approximately 52 billion. The number of brands that collaborated with influencers for sponsored videos was 4,449, which was 4X more than the previous period.
Top Industries for YouTube: By IMV/Spend and Views
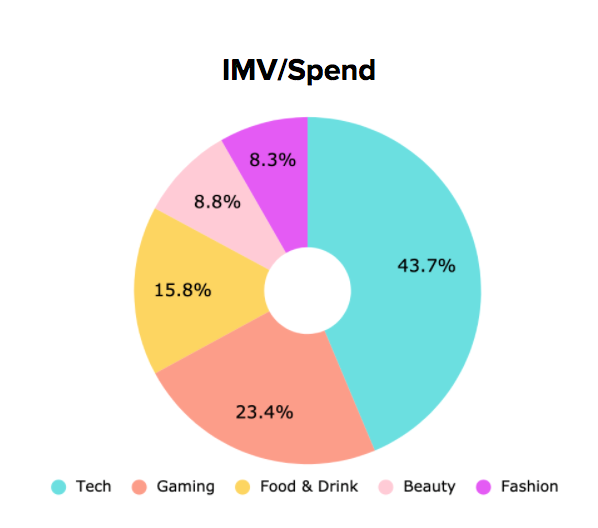
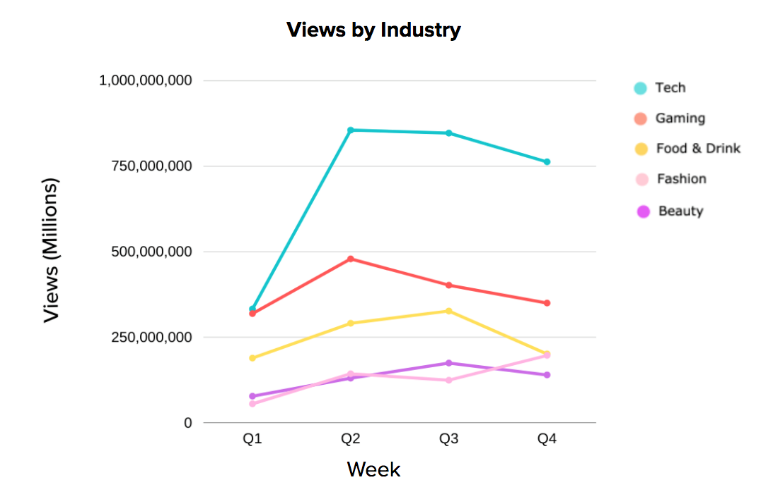
The charts above provide a closer look at the top five industries—tech, food & drink, beauty, gaming, and fashion.
Tech brands contributed 44% of the IMV value and spent double that of the #2 spot holder—gaming brands. It also gained 1.8 times the views as a result.
These five industries spent $825M on YouTube influencer marketing and sponsored videos (by influencers) in 2020 to get more than 6.4B views.
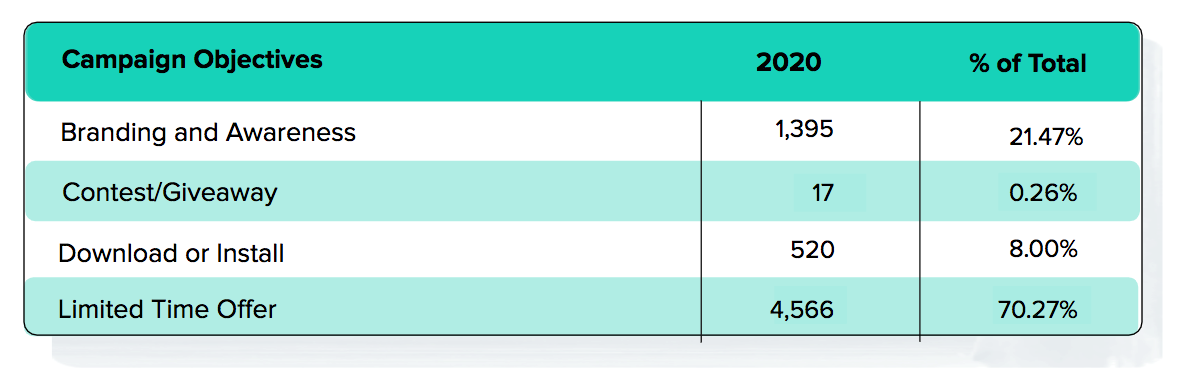
Top Campaign Goals
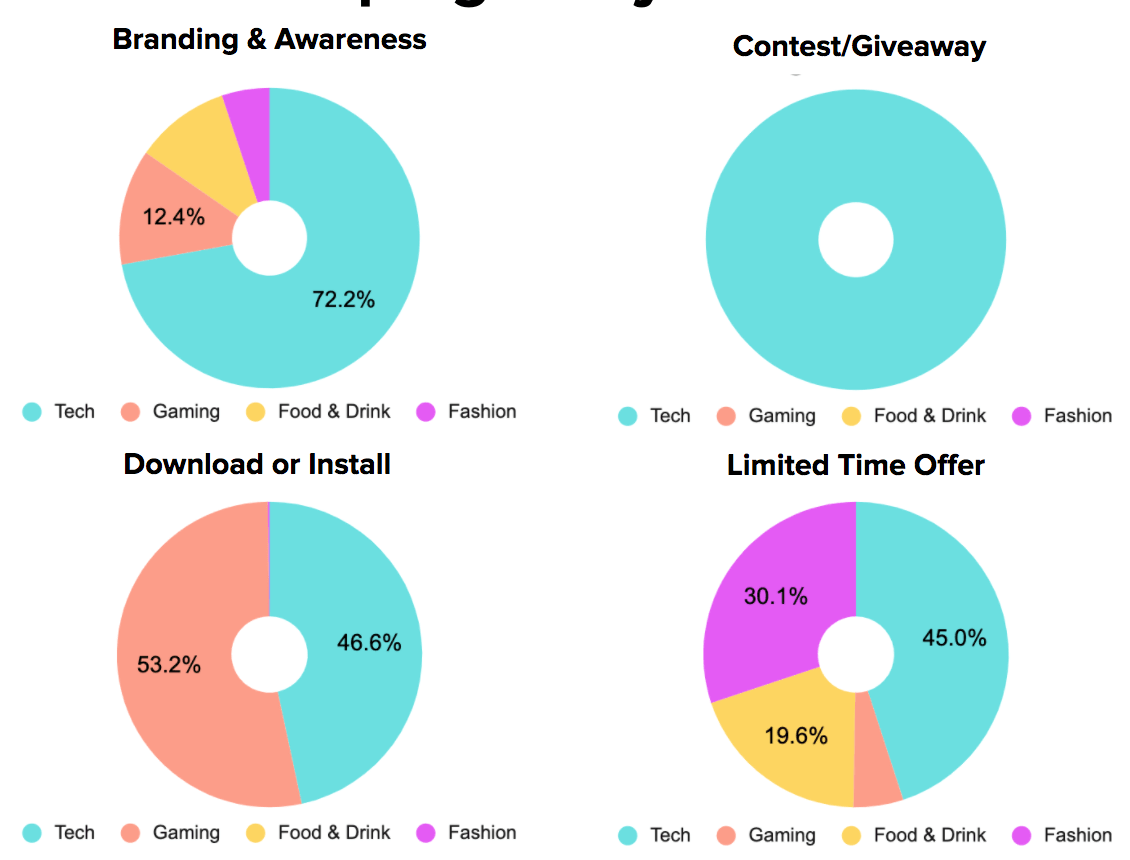
The four key objectives for YouTube influencer marketing and sponsored videos by influencers were to:
- Build brand awareness.
- Promote a contest or giveaway.
- Encourage app or game downloads or installs.
- Promote a limited-time offer.
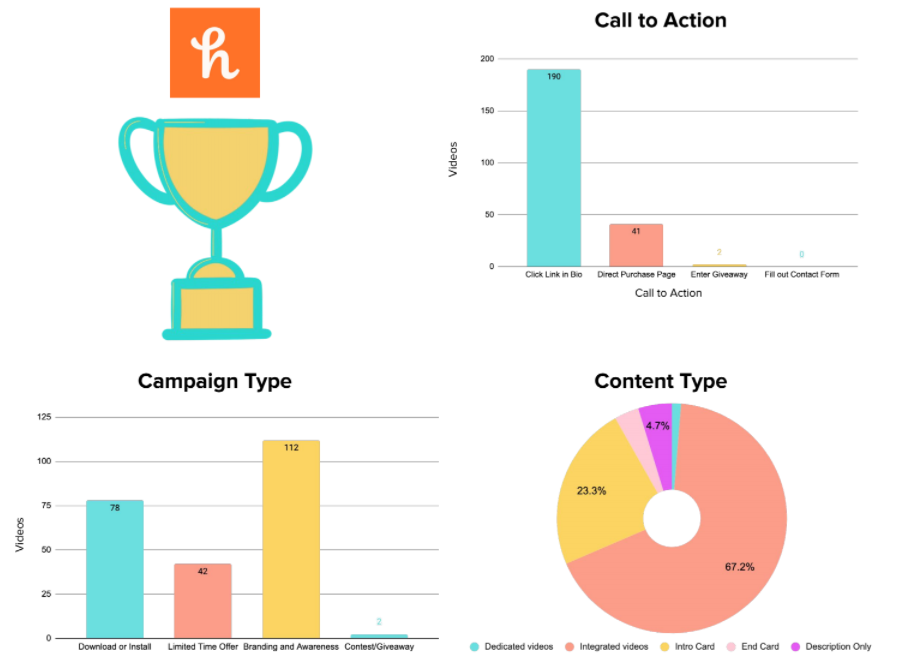
The above graphs compile data from the top ten brands. Limited time offer (to promote a product or generate more sales) was the most popular campaign type. On the other hand, less than 1% of videos promoted a contest or giveaway.
Brands also want to reach more people/audiences beyond their followers or subscribers. That is where the “Branding and Awareness” objective factors in, as it aims to reach more people.
Calls-to-Action (CTAs)
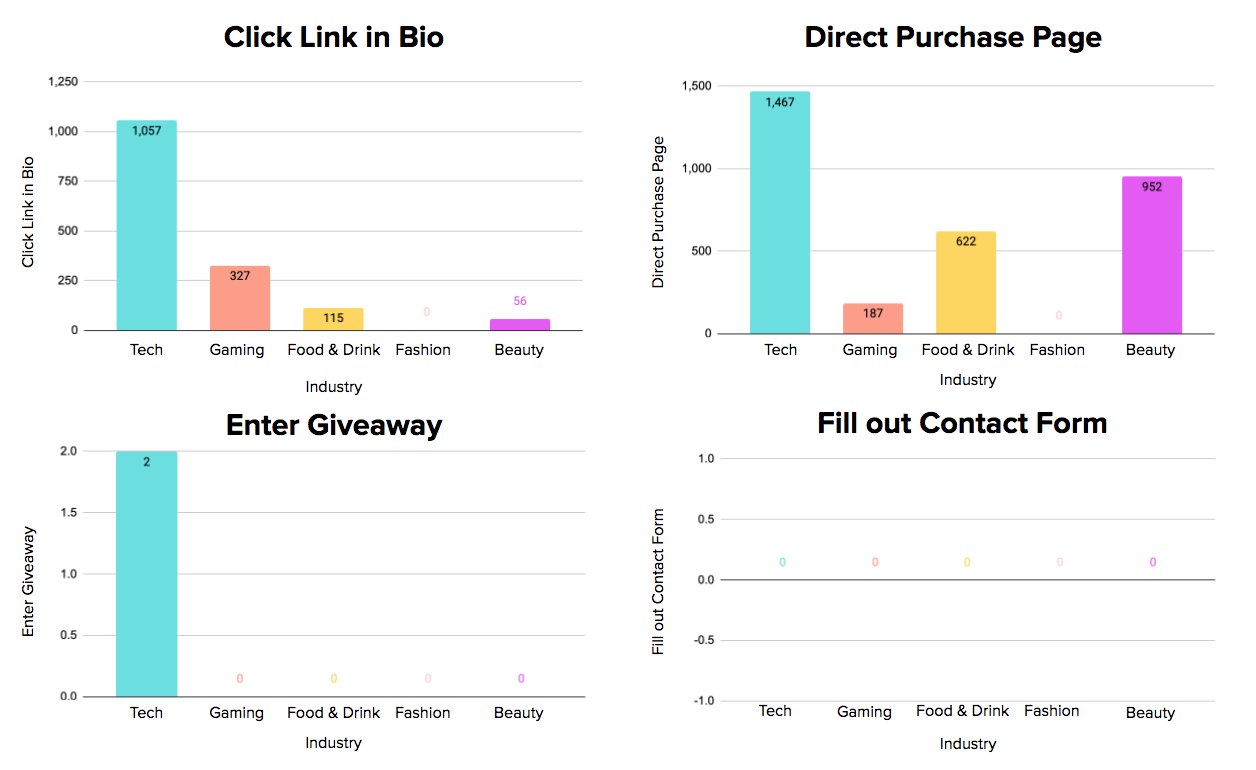
In addition to campaign objectives, sponsored videos by influencers were categorized by the type of call-to-action used.
Almost 90% of the sponsored videos by influencers asked viewers to click on the link in their bios or head to a direct product purchase page. This shows that brands favor direct CTAs that allow them to track and measure the ROI of their YouTube influencer marketing campaigns.
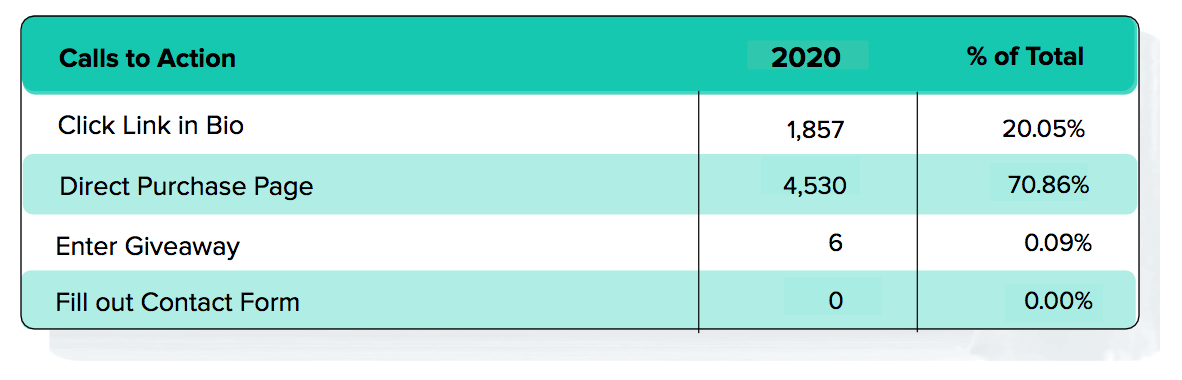
Clearly, “Click Link in Bio” is the most popular CTA for sponsored YouTube video content across industries.
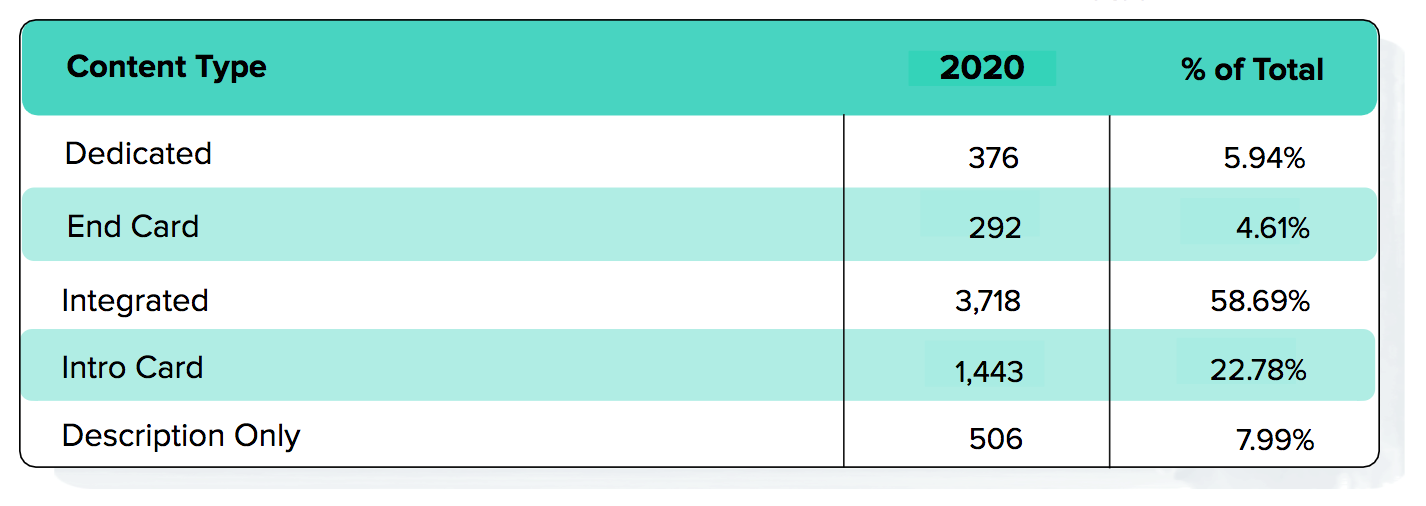
Popular Types of Content
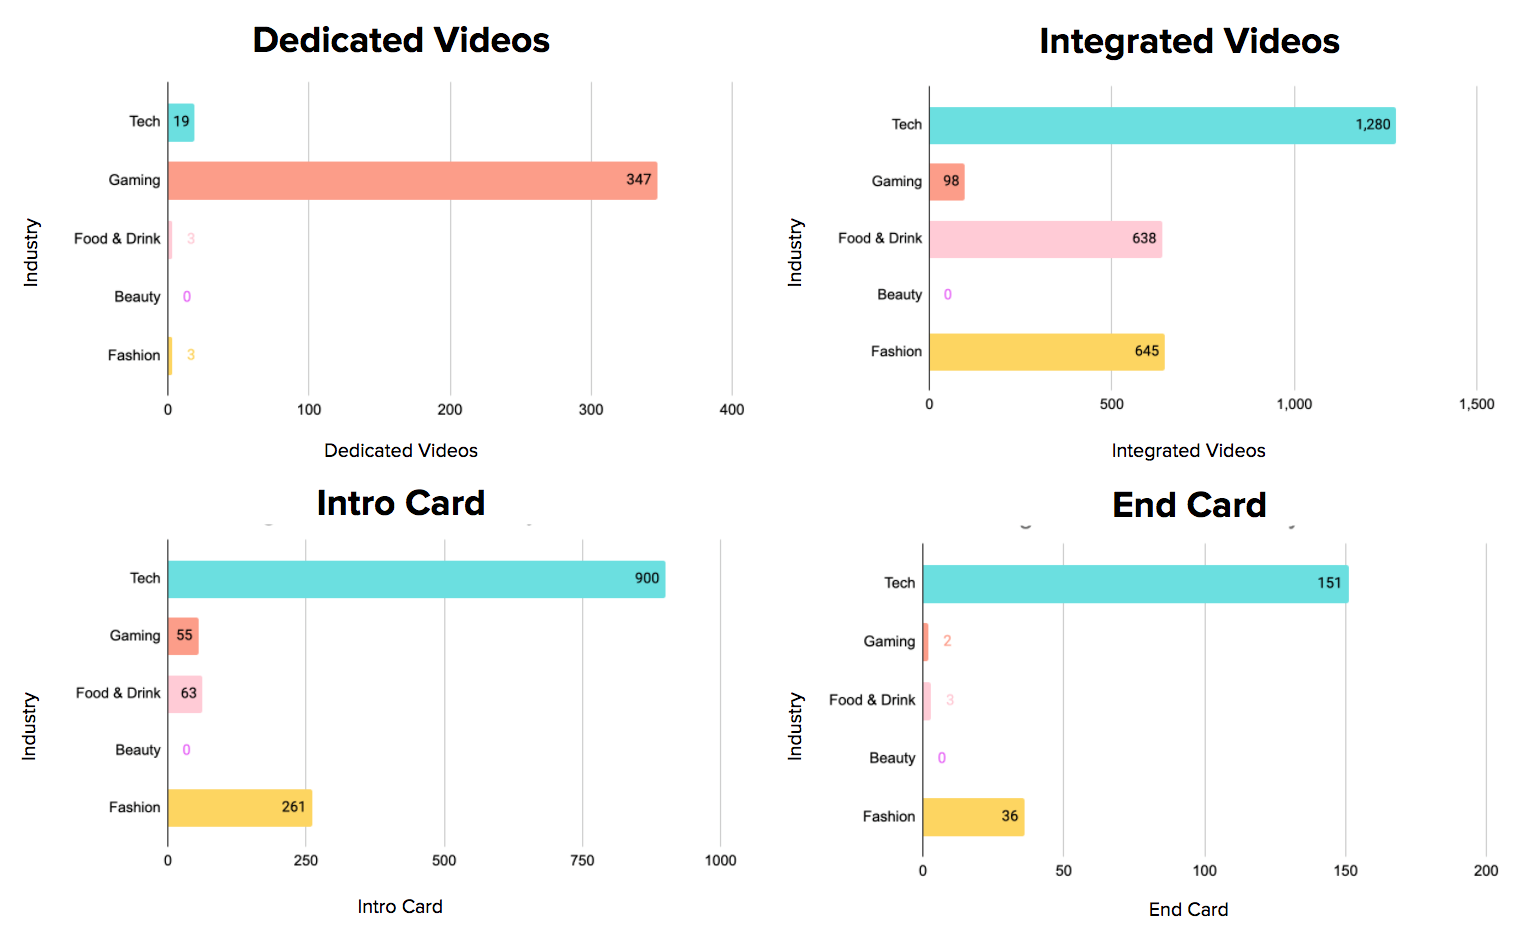
Sponsored videos by influencers varied by the type of content type as well.
Appearing in almost 59% of the sponsored video content from the top 10 brands, integrated content continues to be the dominant content type. Intro cards came second in content types, but they are not even half as popular.
Notably, the gaming and food & drink industries almost exclusively used one type of video: dedicated industry-specific videos. These include popular types of videos like unboxing videos and product review videos.
Top Brands: Categorized by Spend on Influencer Marketing on YouTube
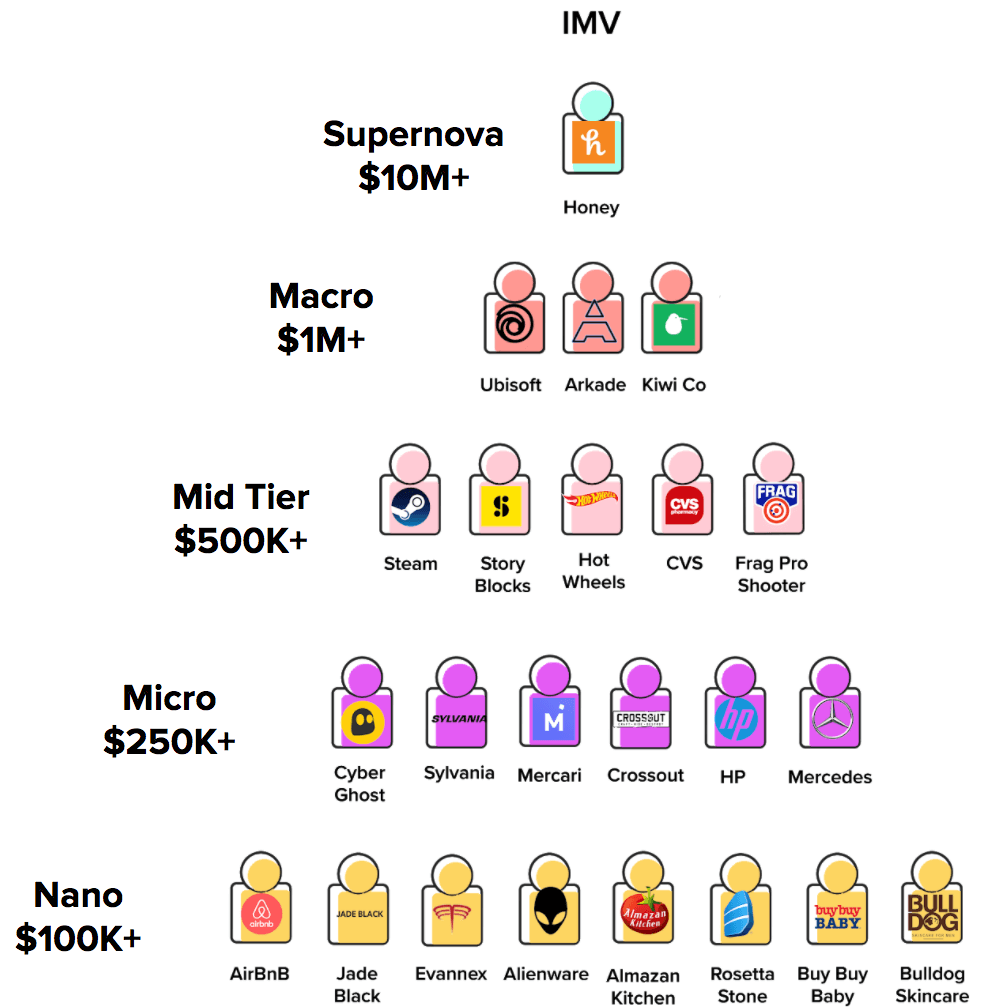
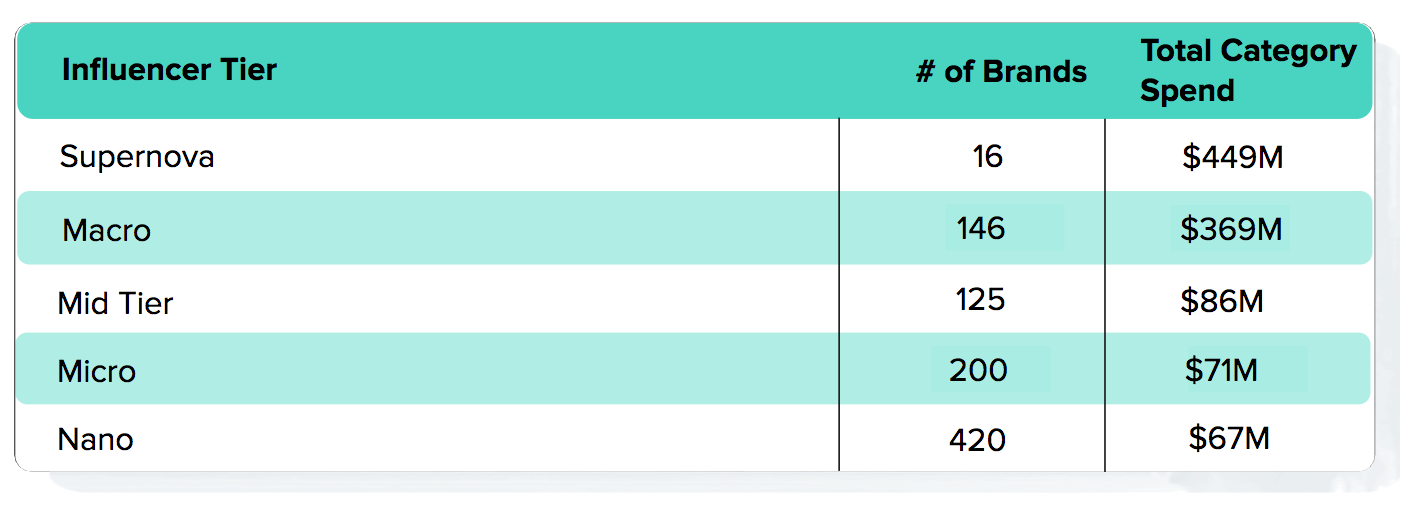
There are 16 brands in the “Supernova” tier. These brands spent more than $10 million on YouTube influencer marketing in 2020. There were 907 brands that spent over $100K on YouTube influencer marketing in 2020.
Though tech, gaming, and food & drink were the highest spenders overall, each tier has brands from different industries. This clearly indicates that any brand or company can and should use YouTube influencer marketing.
Top-Spending Brands on YouTube
The top-spending brands invested $368M in YouTube influencer marketing. The video content sponsored by these companies got over 3.2B views. These brands worked with 1,838 YouTube influencers to create 6,525 sponsored videos.
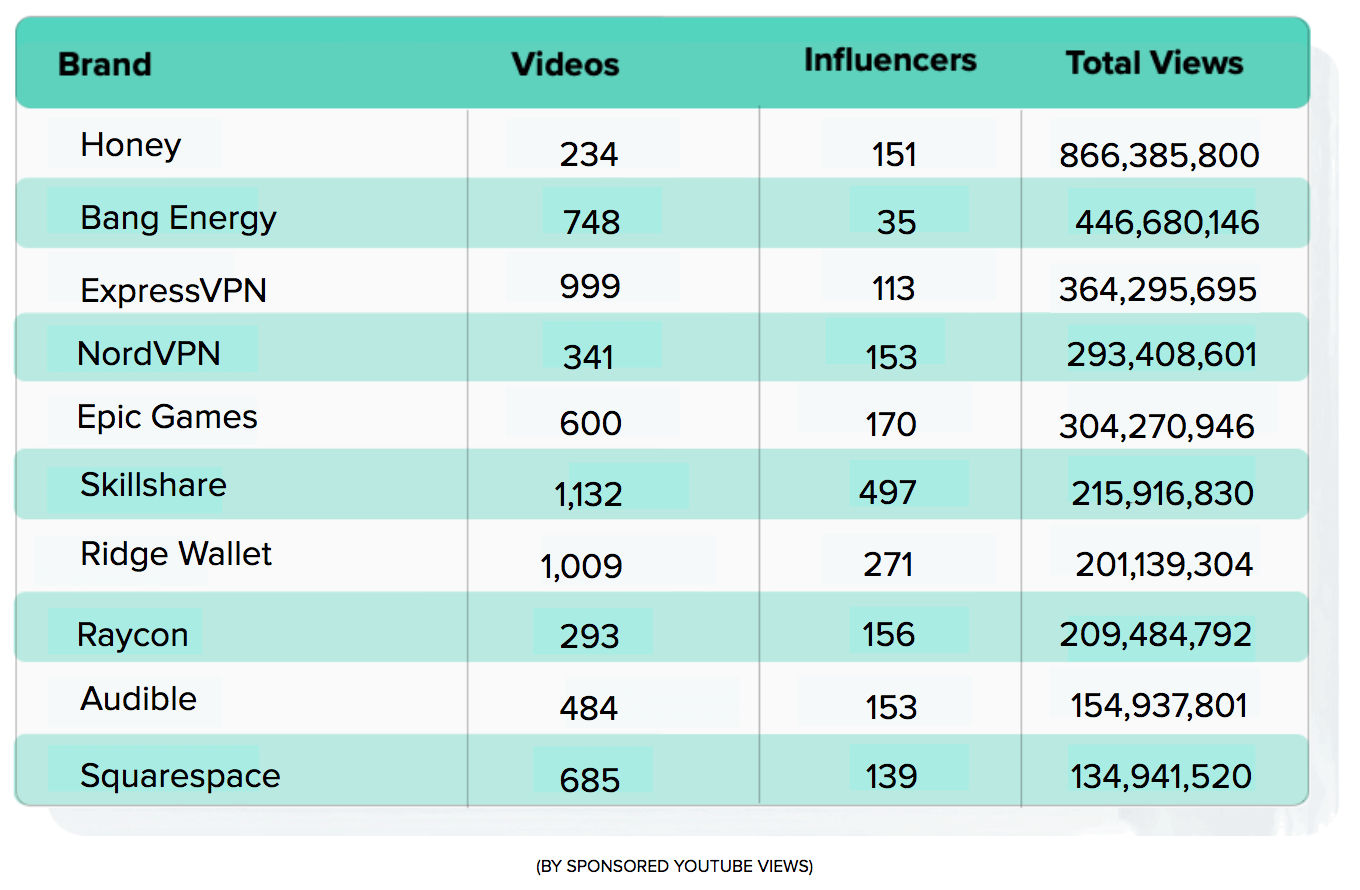
Top-Spending Brands: A Closer Look
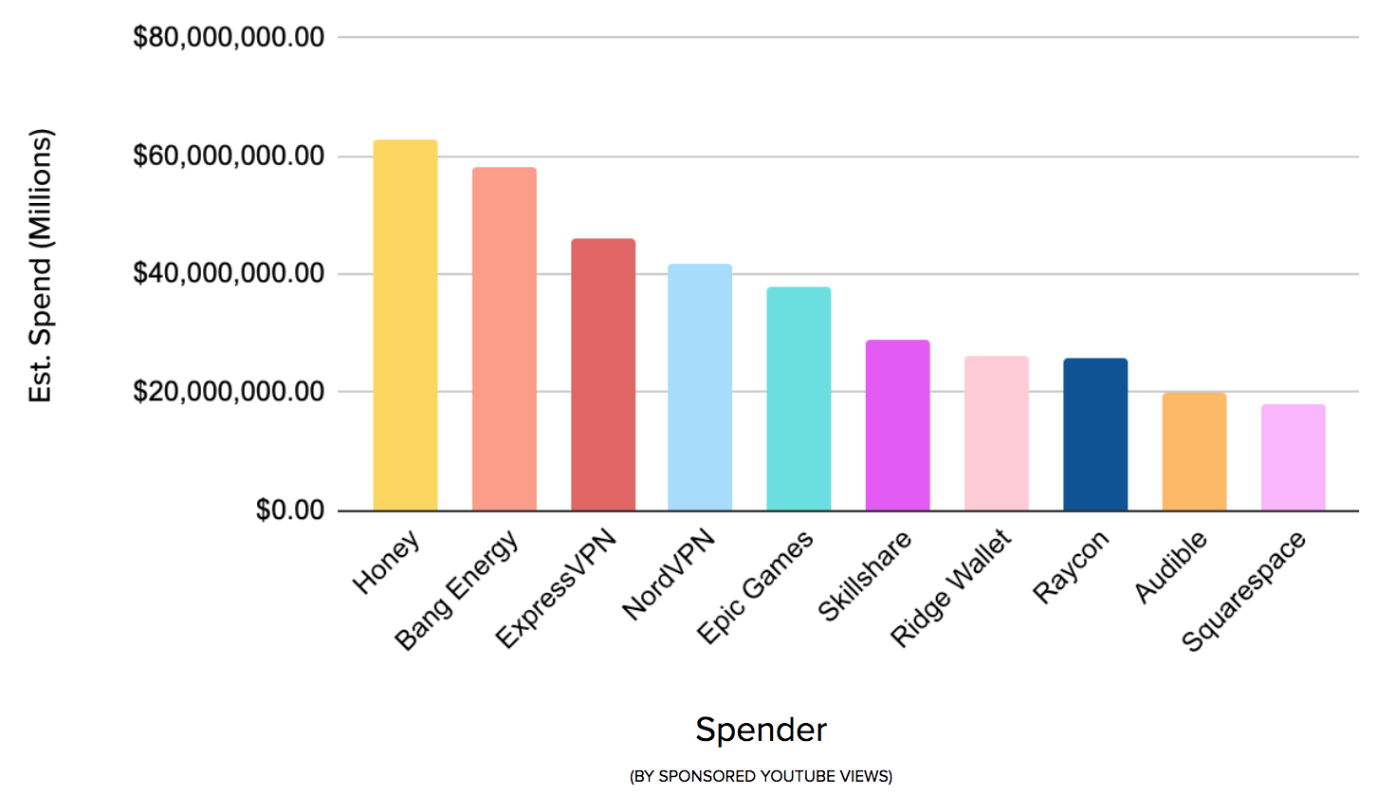
With a gap of over $45M between the spend of the first and tenth brand, Honey was the winner with a spend of $62.7 million.
Even with a total spend of more than $366 million, these top ten brands only account for 33% of the annual spending on sponsored videos on YouTube. But, you will notice that most of these brands belong to one of the top three highest-spending industries.
This upward trend continues to support influencer marketing’s positive effects on business growth and profit. YouTube influencers can help brands reach highly specific audiences, and brands are reaping the benefits.
Viral Videos
Why does a video go viral?
Well, seems like some brands like the ones mentioned above have figured it out. See these stats from their viral sponsored video campaigns in 2020.
Top-Spending Brands: Ad Length
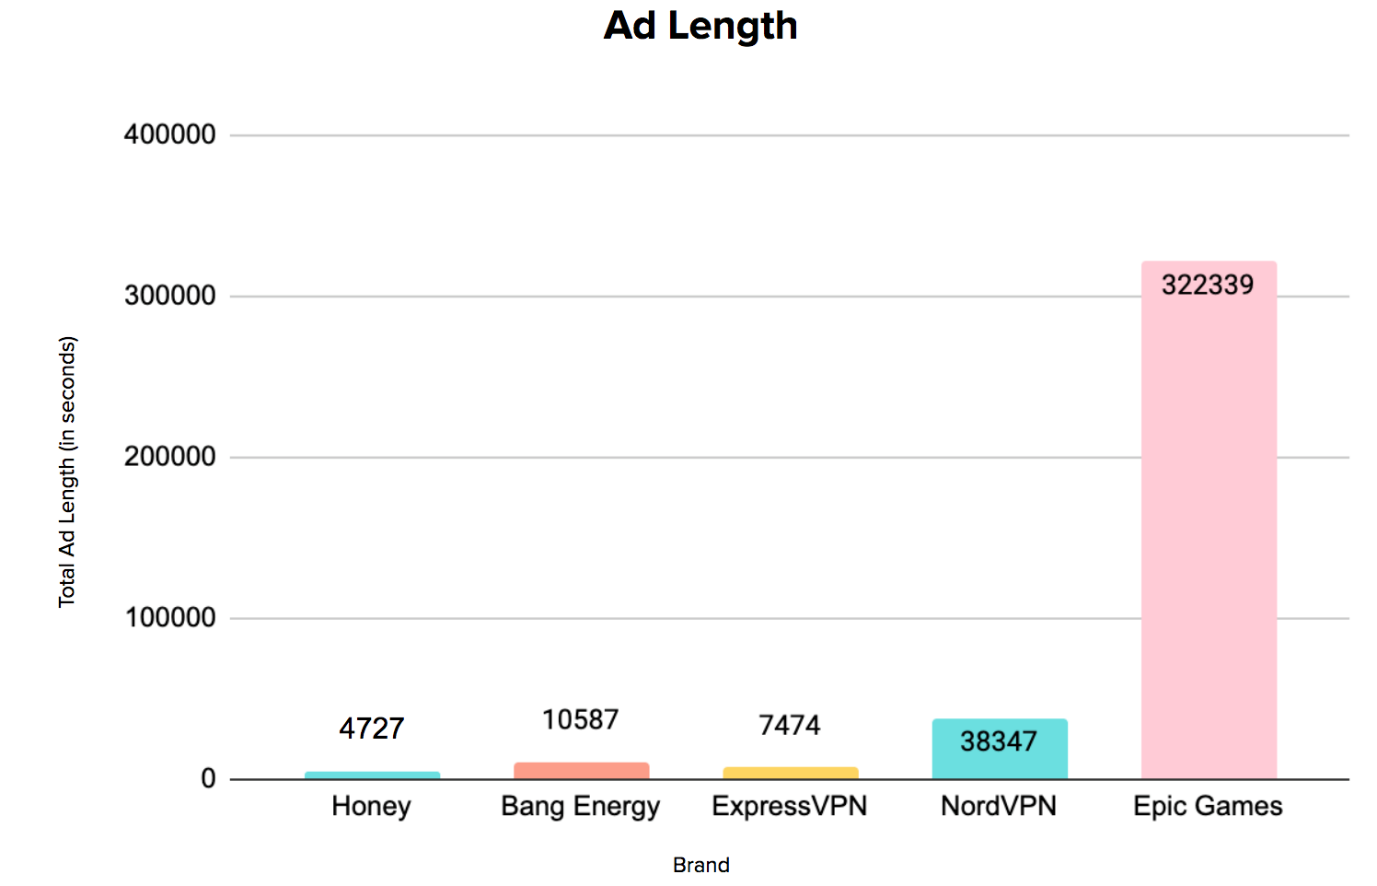
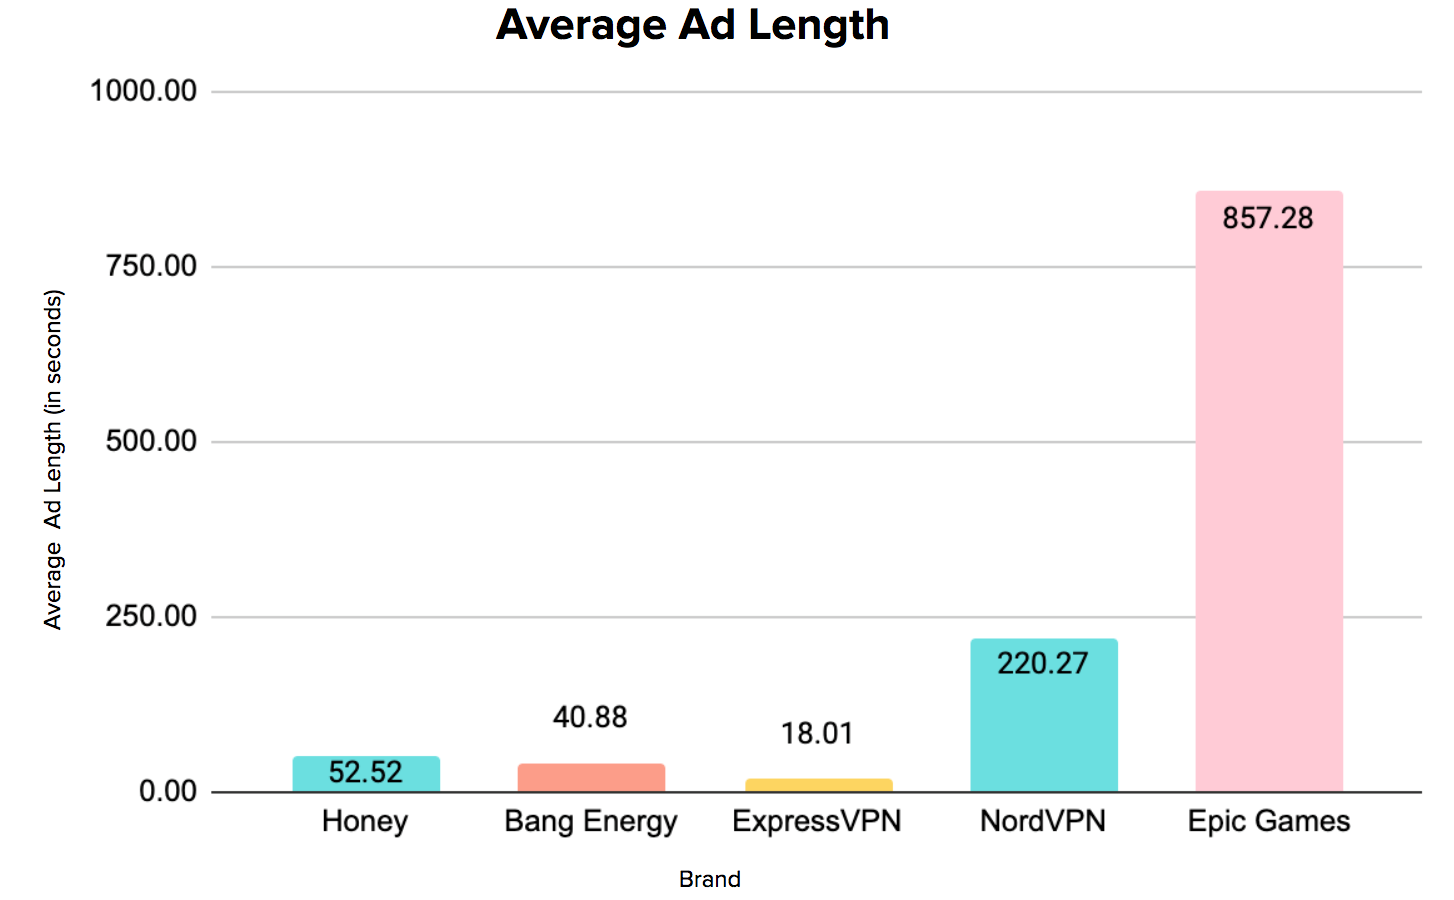
The total ad length for the top five brands was 383,454 seconds. Epic Games had an 84% share of this. With a total of 322,339 seconds of sponsored videos (by YouTube influencers), Epic Games held the stage for quite a while.
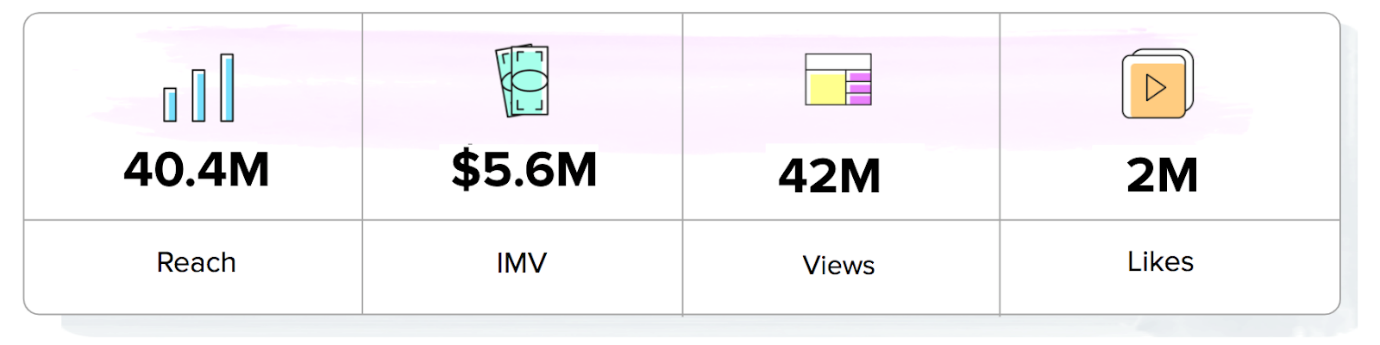
Brand Showcase: Honey
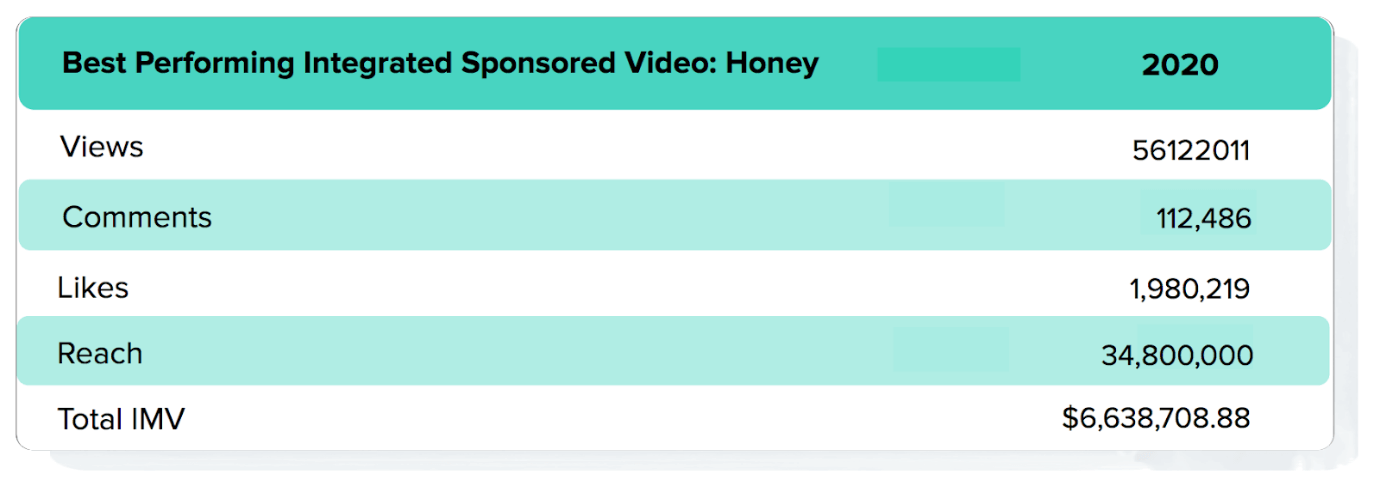
Honey has consistently been a high spender throughout the year. These metrics show the benefits that it reaped from YouTube influencer marketing and sponsored videos.
We can further break down the campaign strategy for Honey by the types of content, CTAs, and campaign types they used.
Fastest-Growing Brands
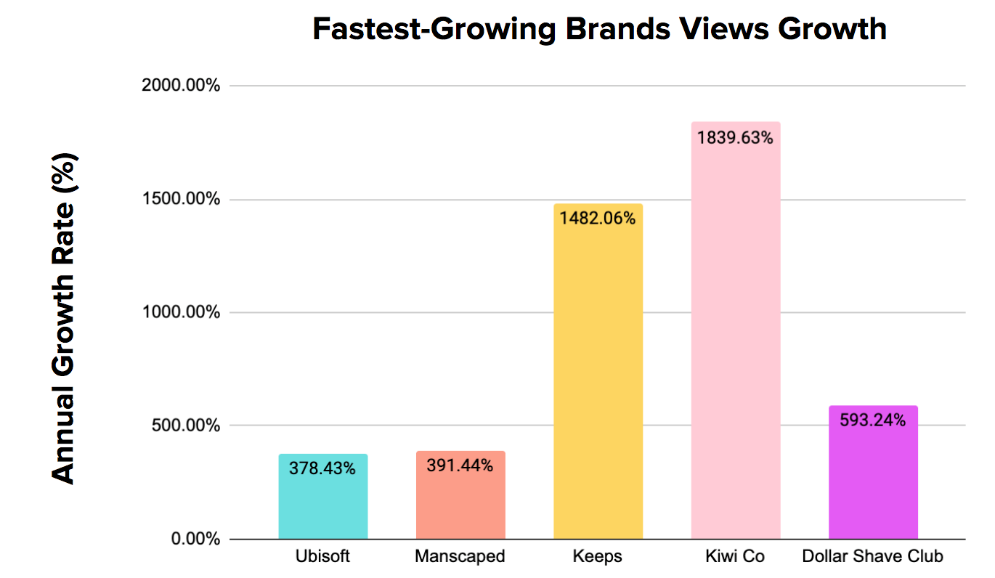
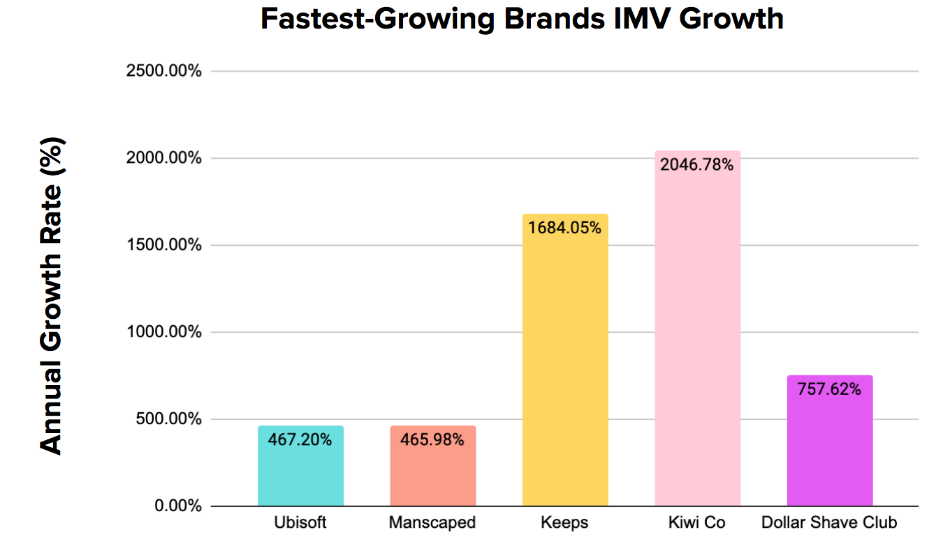
The brands mentioned in the image above experienced a spike in IMV and views in 2020, and it was due to YouTube influencer marketing majorly.
KiwiCo had the highest increase in IMV that the brand achieved by increasing its spending by 2047%. The views on the brand’s sponsored videos grew by 1840%.
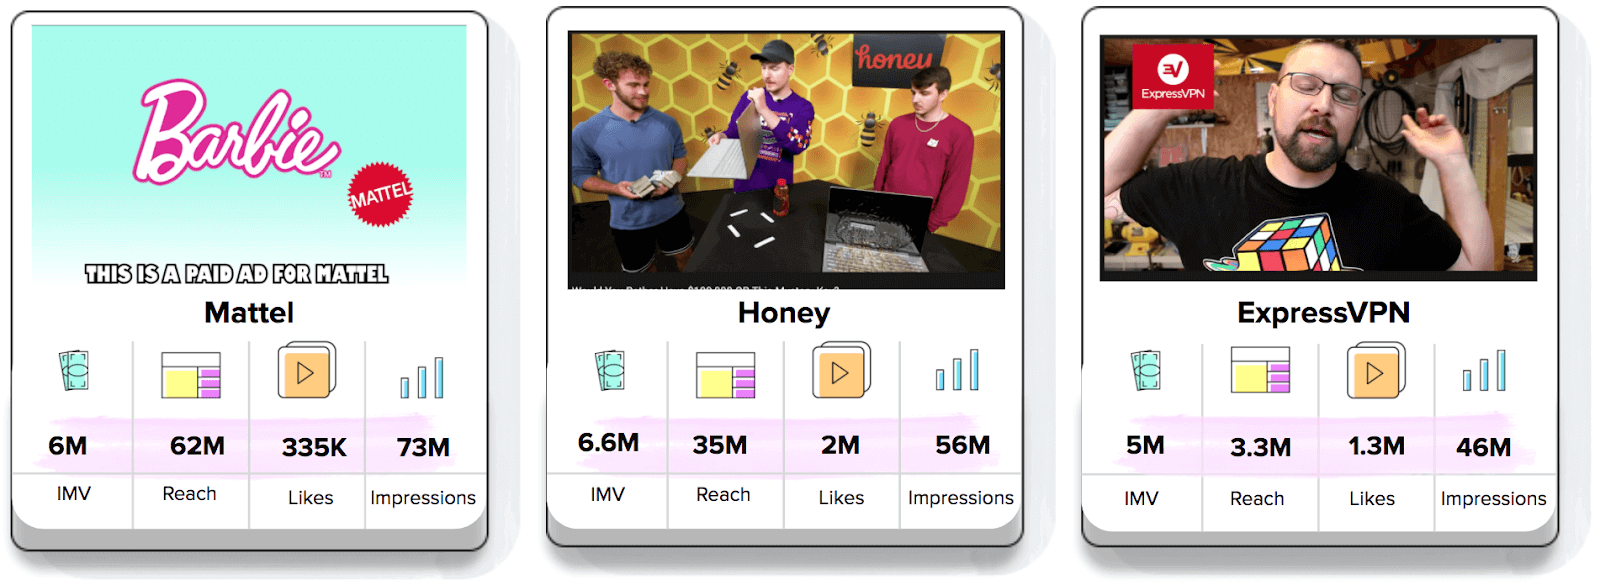
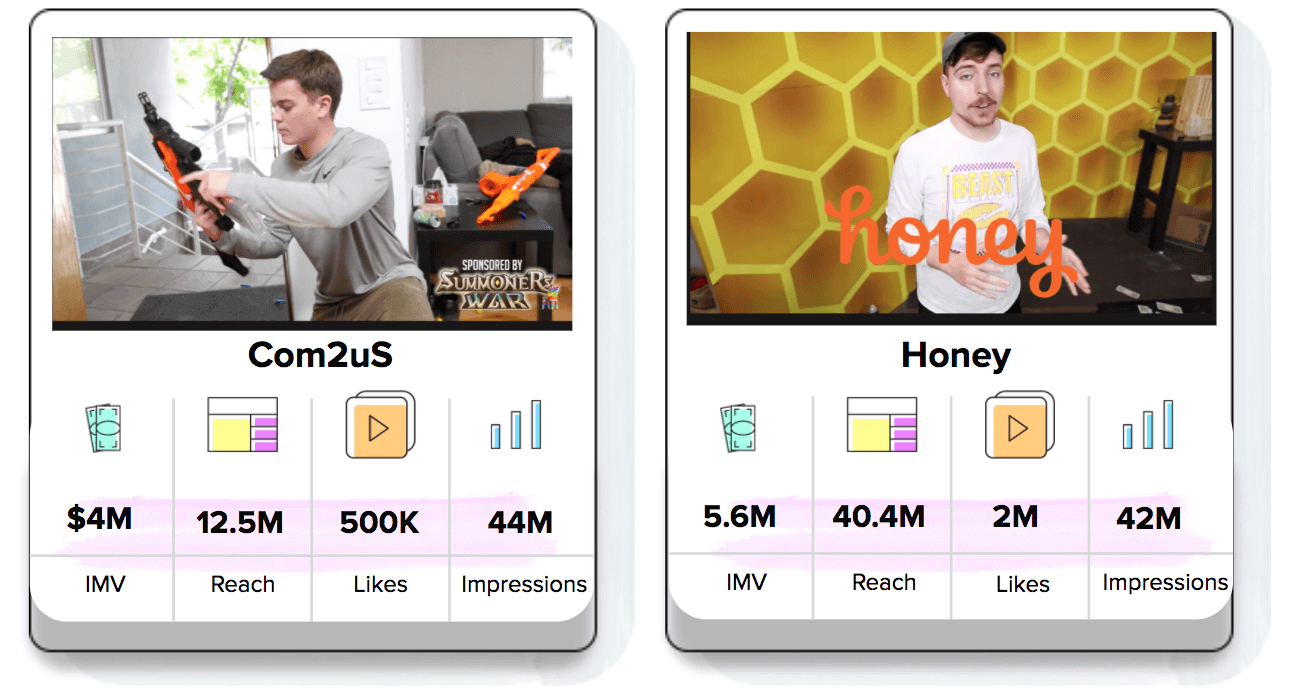
Top Videos 2020

As for the top sponsored posts (by YouTube influencers) of 2020, the nominees come from the toys, tech, and gaming industries. These videos had an IMV of $5-$6M and views in the range of 39.3M to 72.9M each.
Brands with Highest and Lowest CPV (Cost Per View)
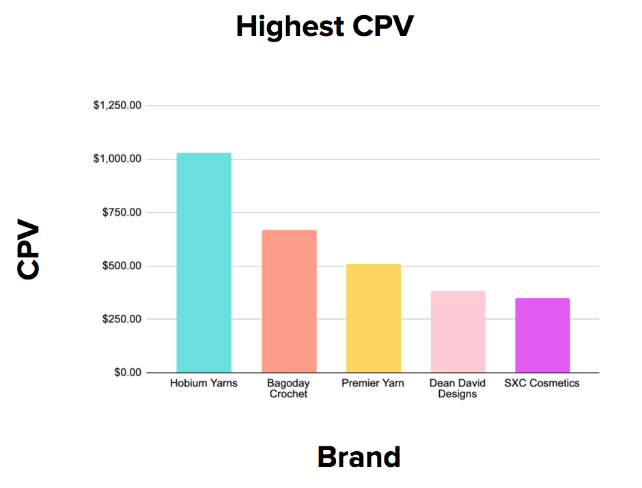
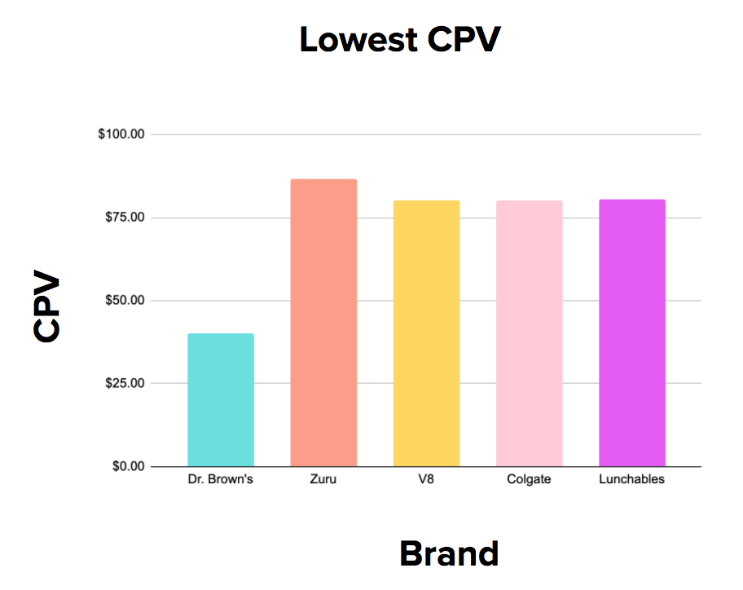
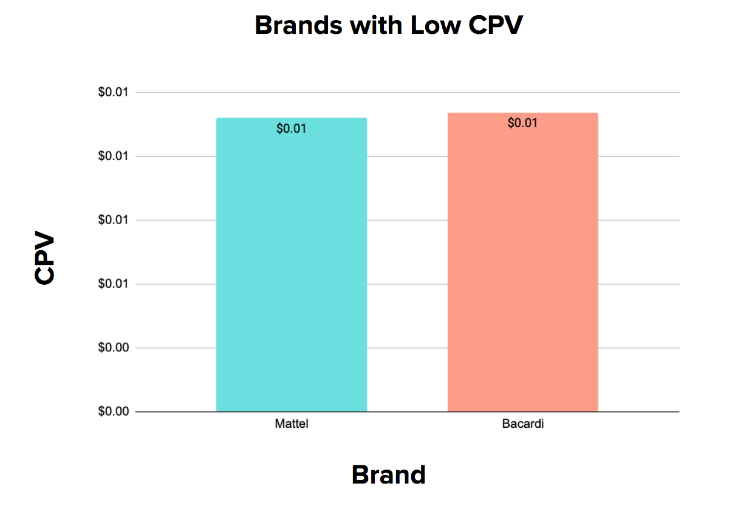
When determining campaign success, cost per view is a great indicator. The less money you spend to get more views, the better.
NeoReach compared brands and ranked them by the calculated CPV.
The first chart shows some of the best brands in terms of the CPV of their videos. For comparison, we have added the third chart with some popular brands that have really low CPV to show just how impressive these campaigns were.
Top Brands: By Brand Sentiment
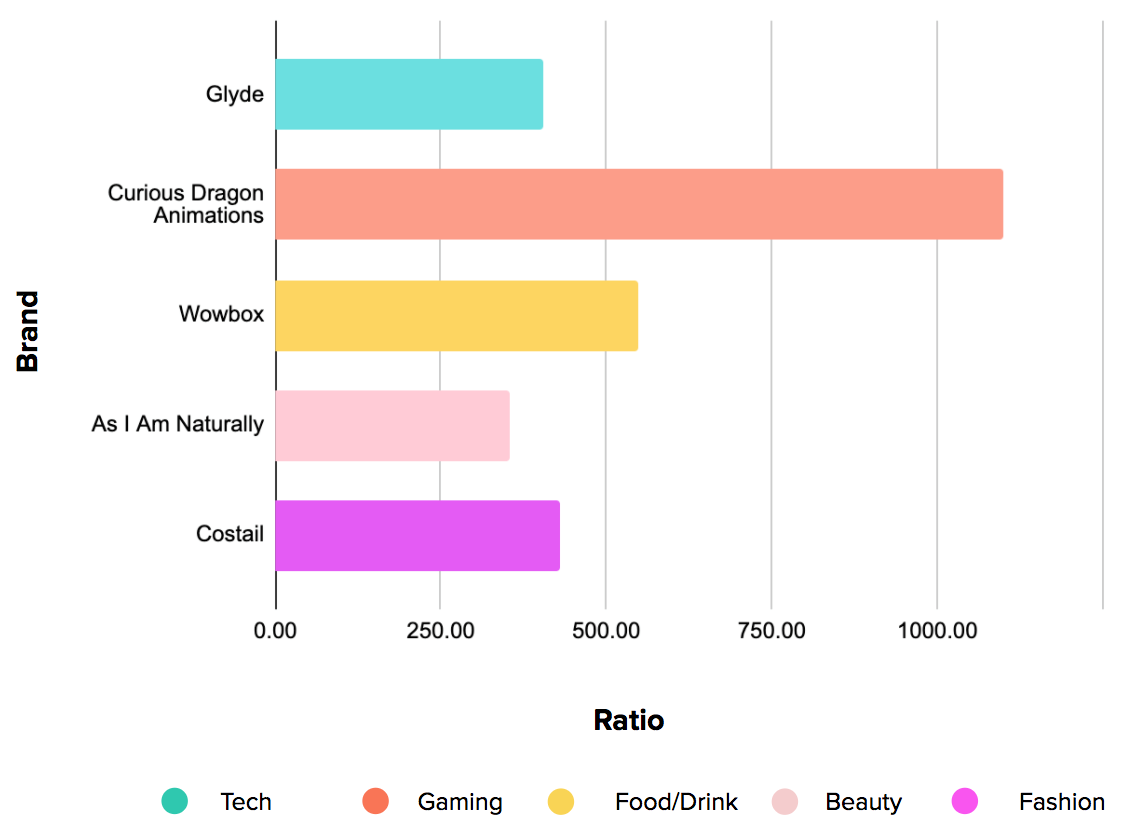
Brand sentiment is an important factor in influencer campaigns. After all, your viewers’ opinions matter the most.
If the audience response for your sponsored video is good and viewers talk positively about it, then it can increase the video’s reach.
To determine audience response or brand sentiment, we can look at the average like-to-dislike ratio for companies. Curious Dragon Animations had the most positive brand sentiment. It had a like-to-dislike ratio of 1100, which is double that of WOWBOX (a brand in the #2 spot).
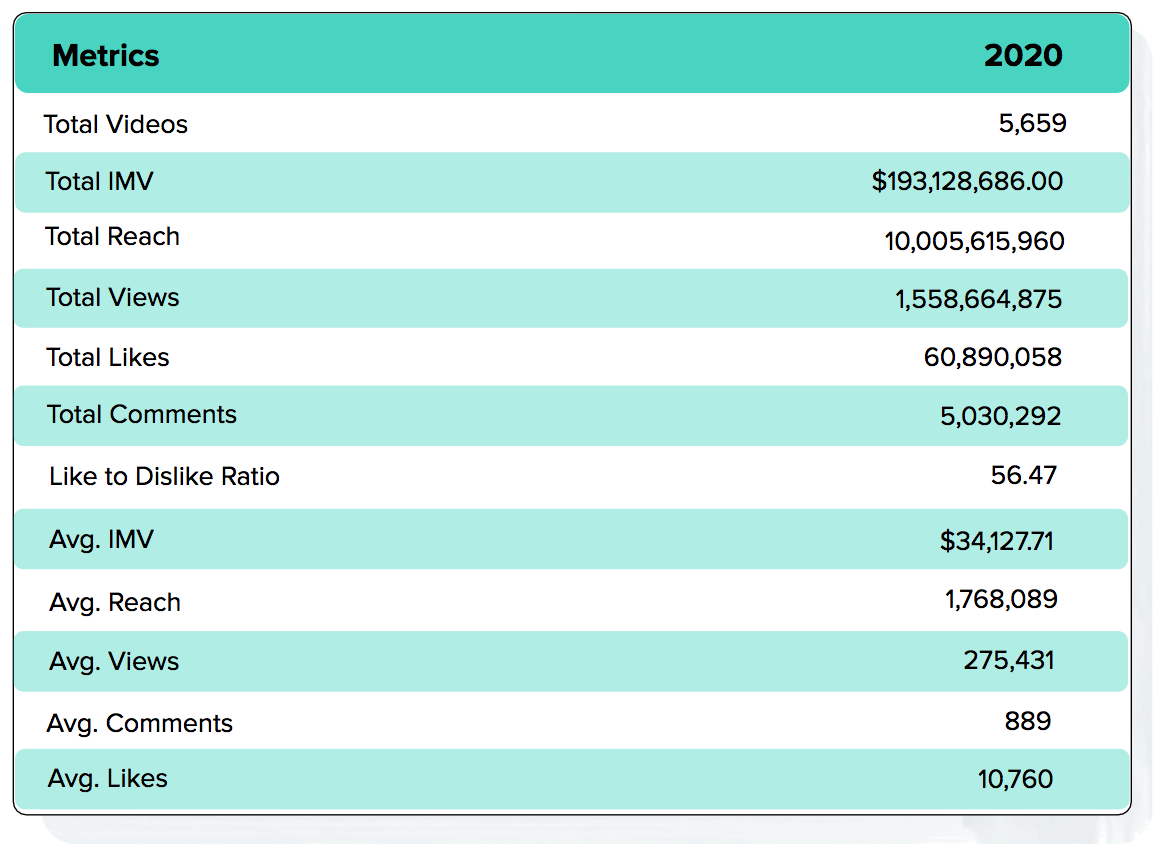
Top Industries: Key Metrics Breakdown
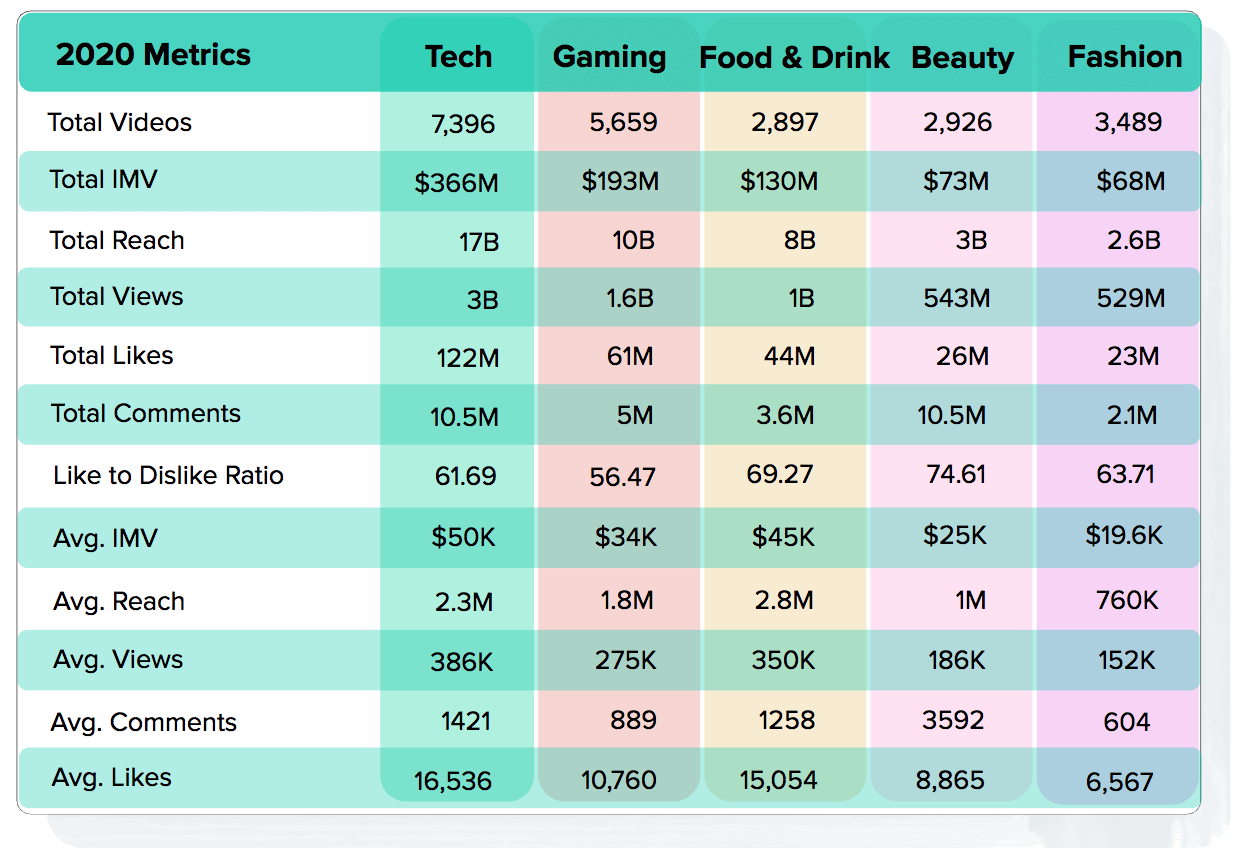
Want to see the key performance metrics of YouTube influencer marketing in 2020 for the top industries?
Well, that’s what the table above shows.
In addition to the industry data shared previously, this table shows all important metrics for each industry, compared side by side to give a complete industry benchmark.
With a reach of 17 billion, the tech industry was at the number one spot. This is not surprising, considering that they sponsored 7,396 videos as compared to the gaming industry (rank 2), which had 5,659 sponsored videos.
The beauty and tech industries both had 10.5M total comments, a testament to high audience engagement and word-of-mouth marketing by viewers in those industries.
Top-Spending Brands: Monthly Data
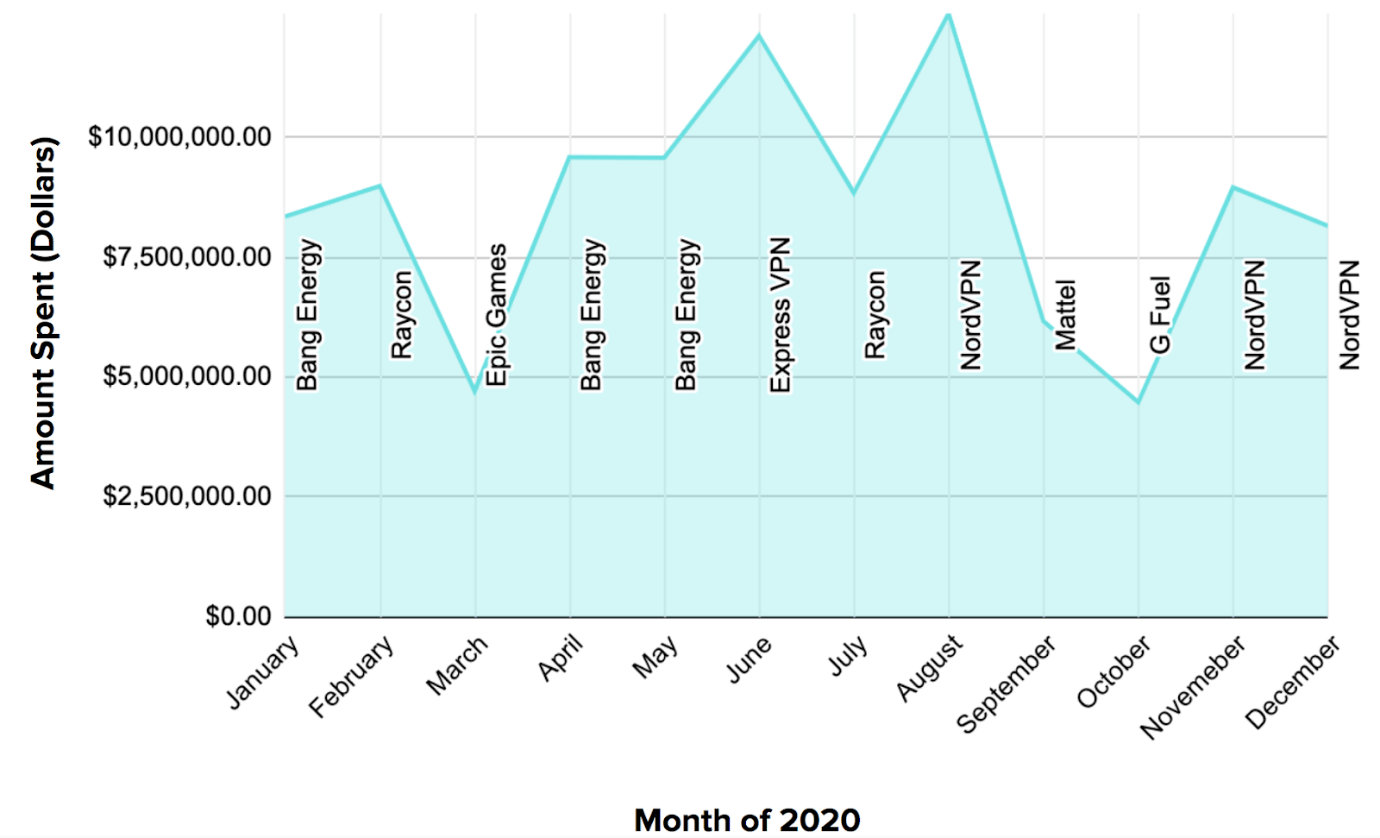
This graph condenses the weekly data for the entire year to show the top-spending brand each month. With a whopping $12.6M spend in August, NordVPN is the highest-spending brand of the year.
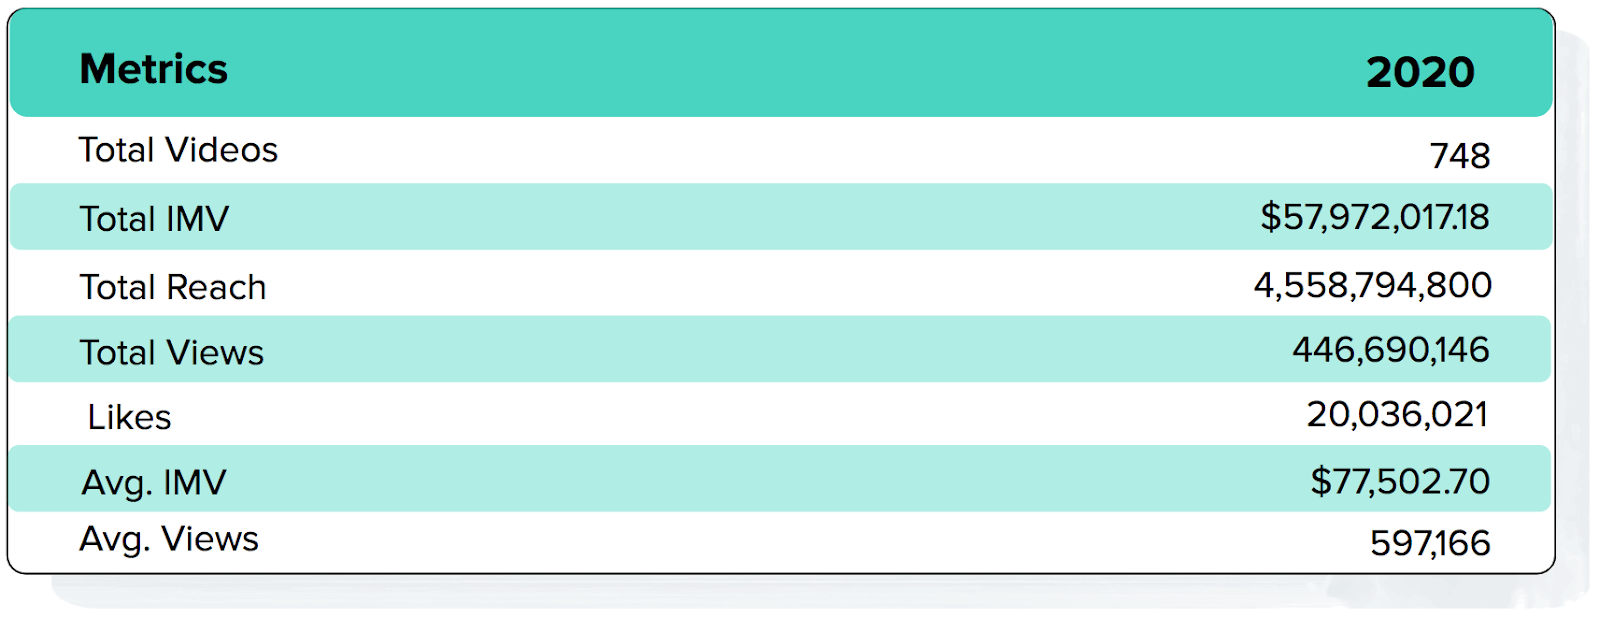
Key Metrics: Annual Overview
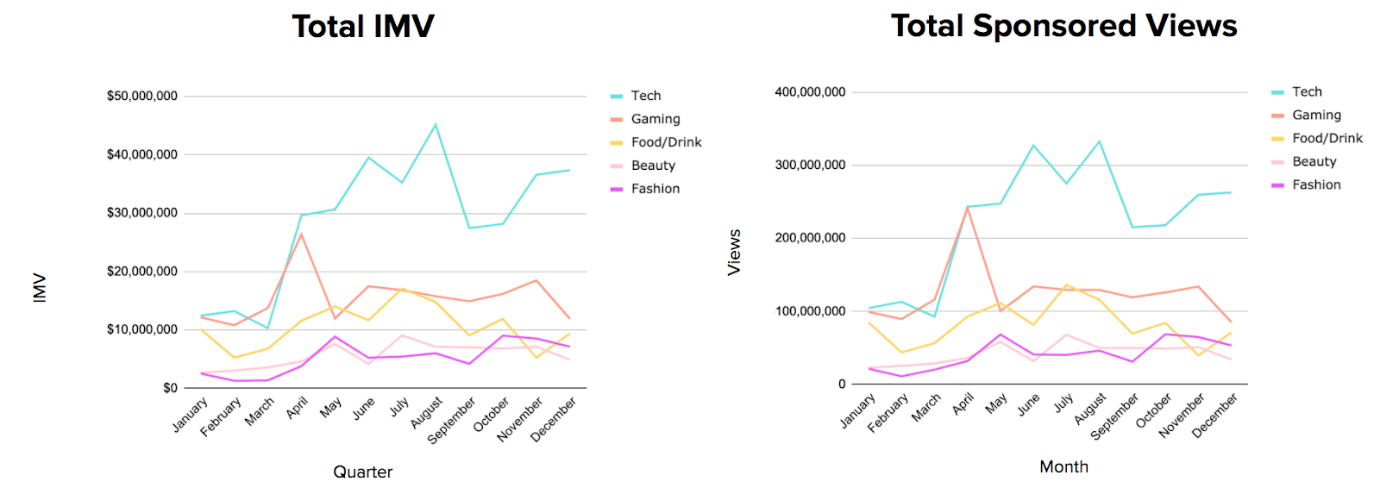
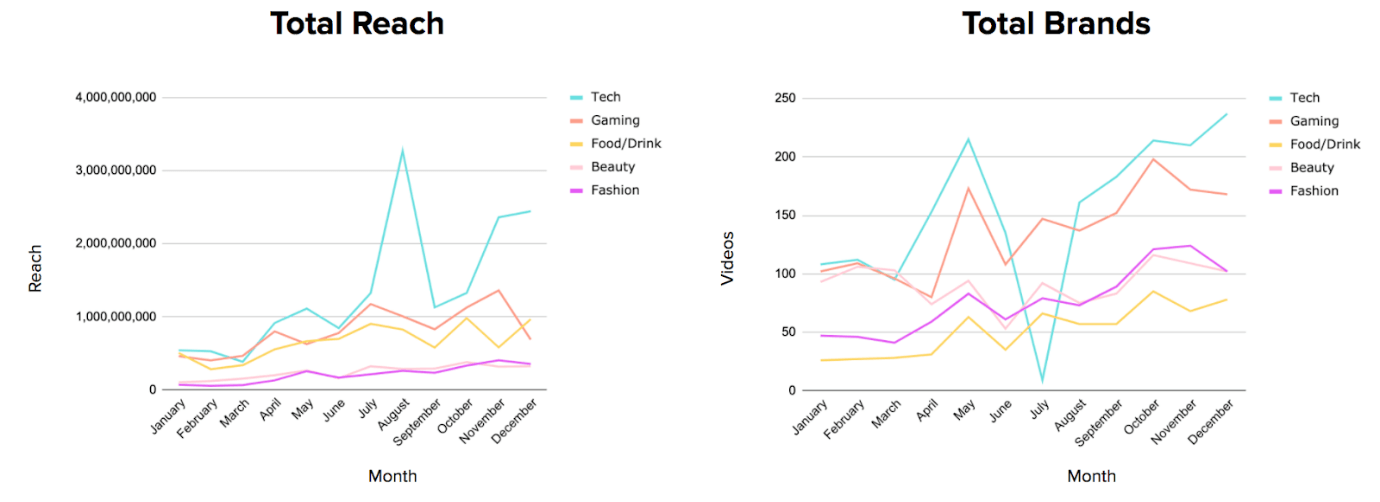
In 2020, the tech industry surpassed the other top four industries with the highest views and maximum reach. It also had the highest number of brands that contributed to YouTube influencer activations.
There is a strong positive correlation between sponsored views and IMV for all of the industries, another win for YouTube influencer marketing.
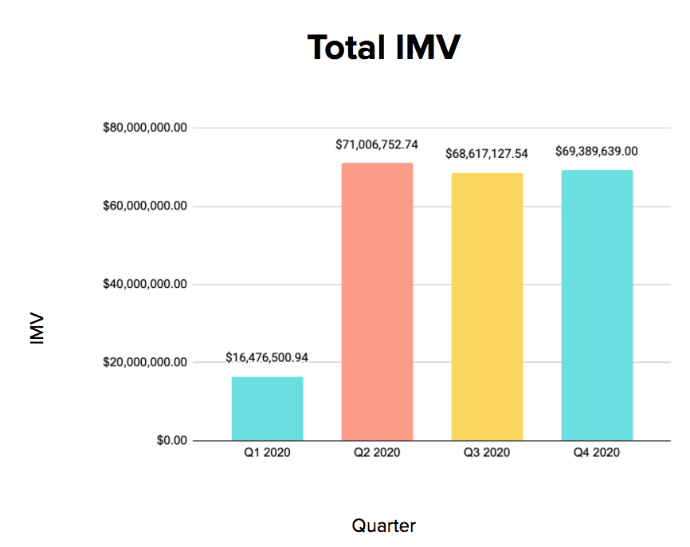
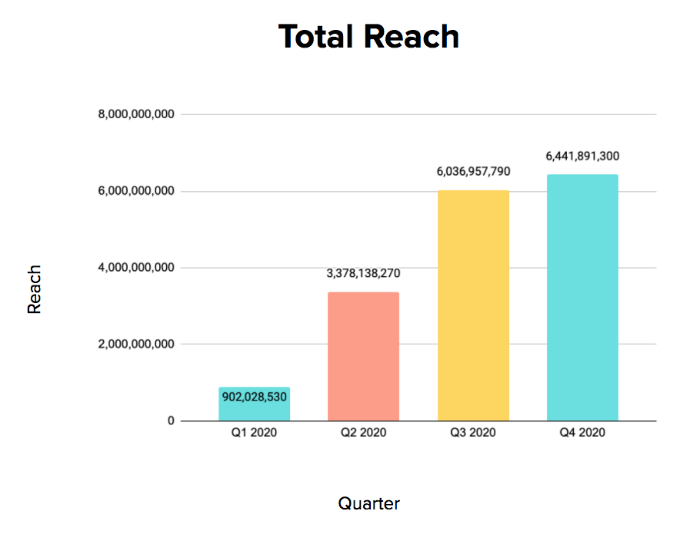
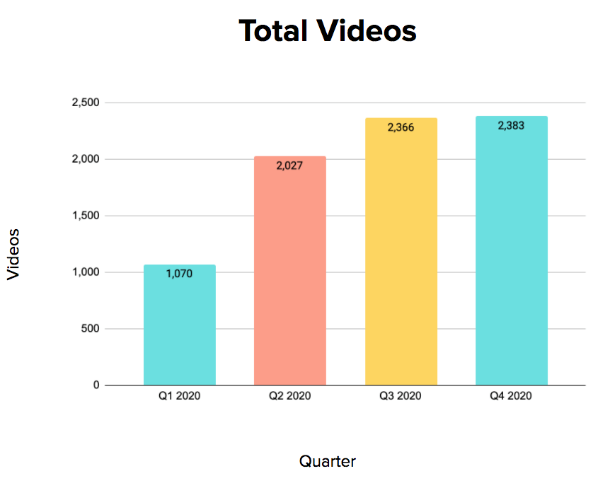
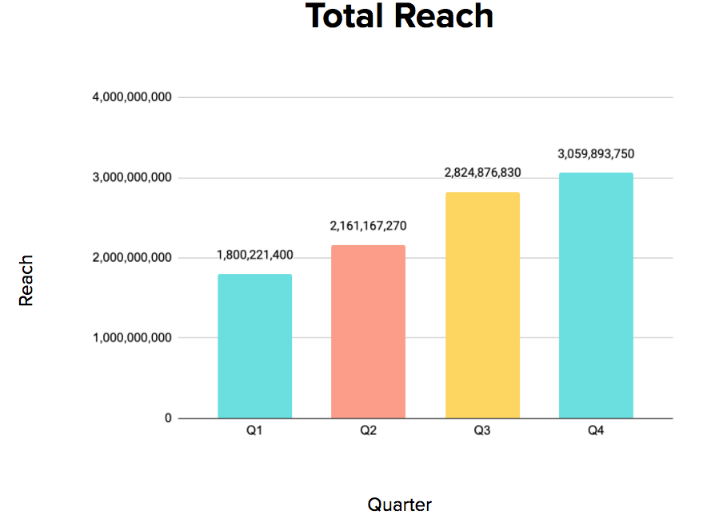
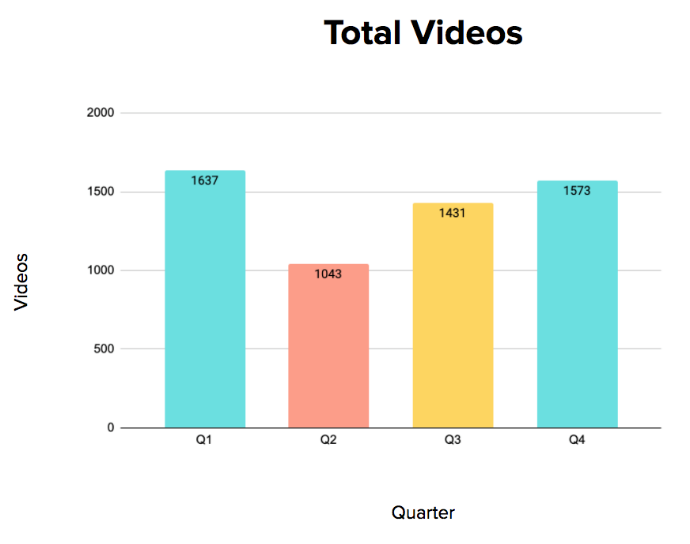
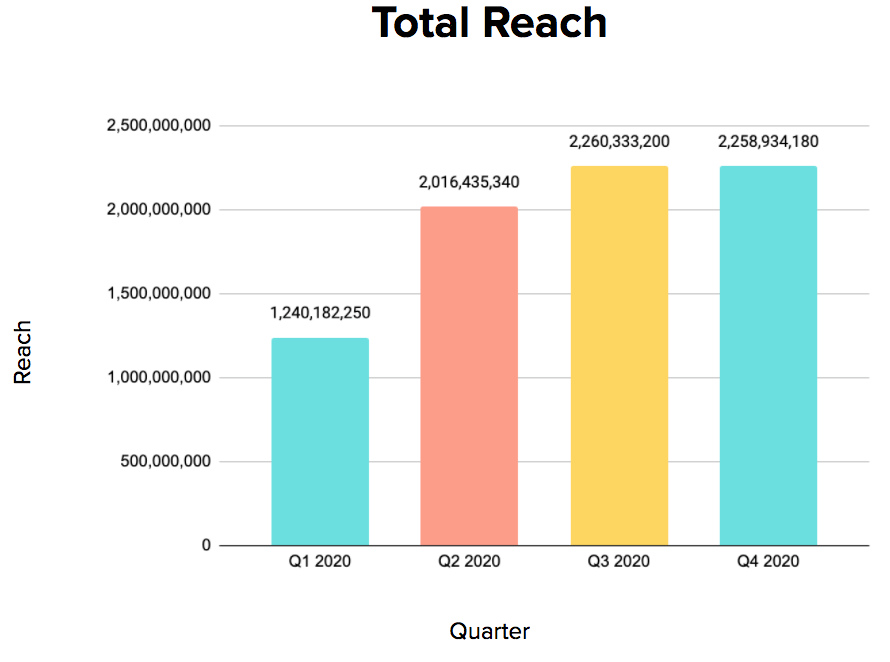
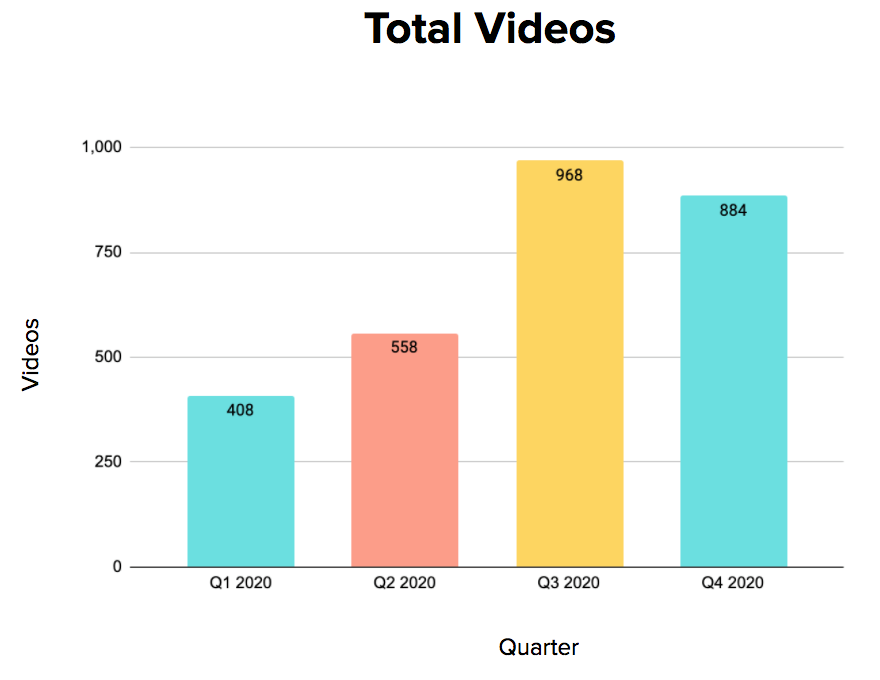
Key Metrics – Quarterly Data
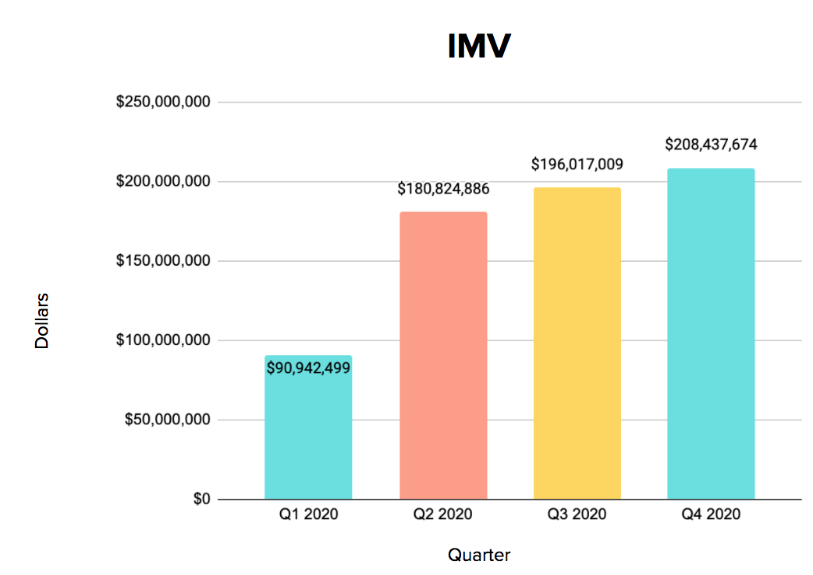
There was a consistent increase in total IMV across all four quarters. The largest jump was $90M in Q2.
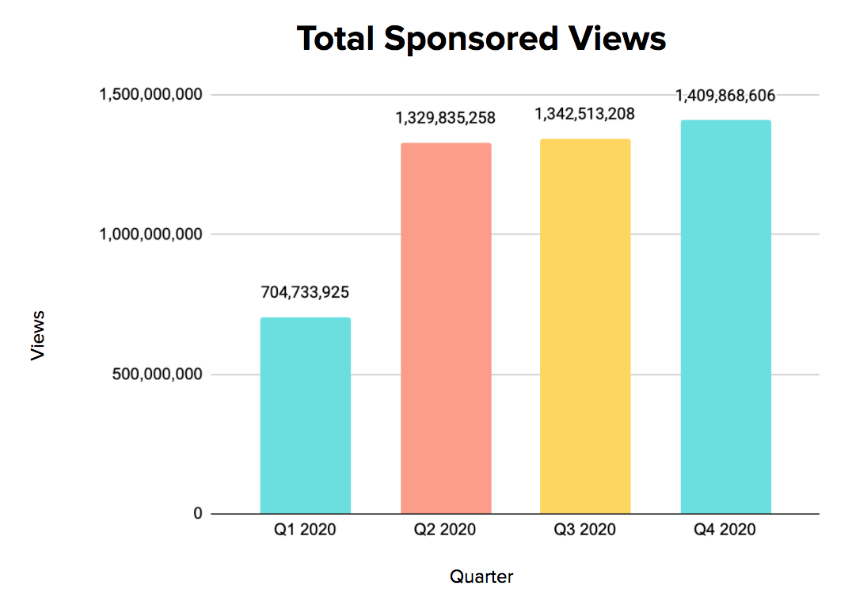
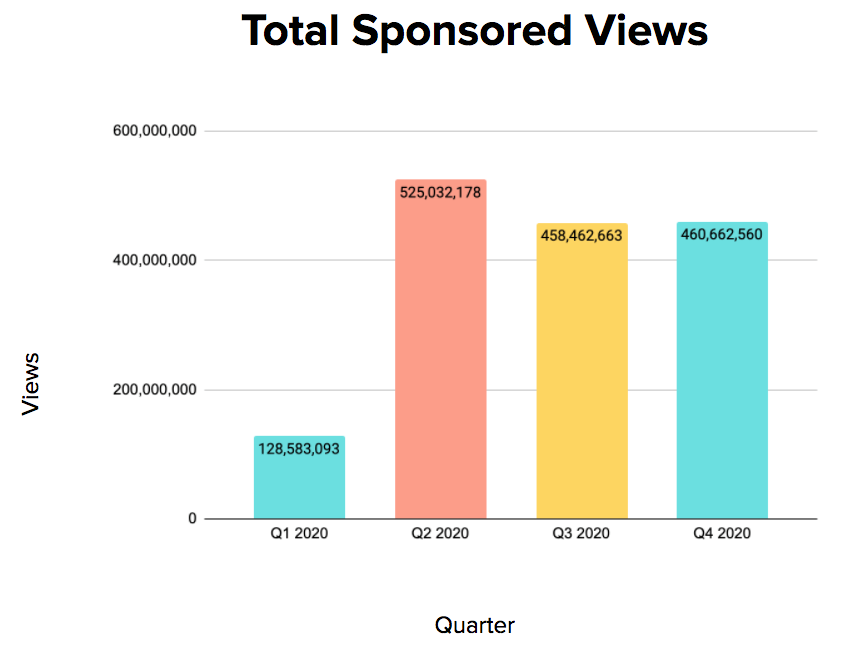
Total views almost doubled in Q2 but plateaued at around 1.3 million to 1.4 million for the rest of the year.
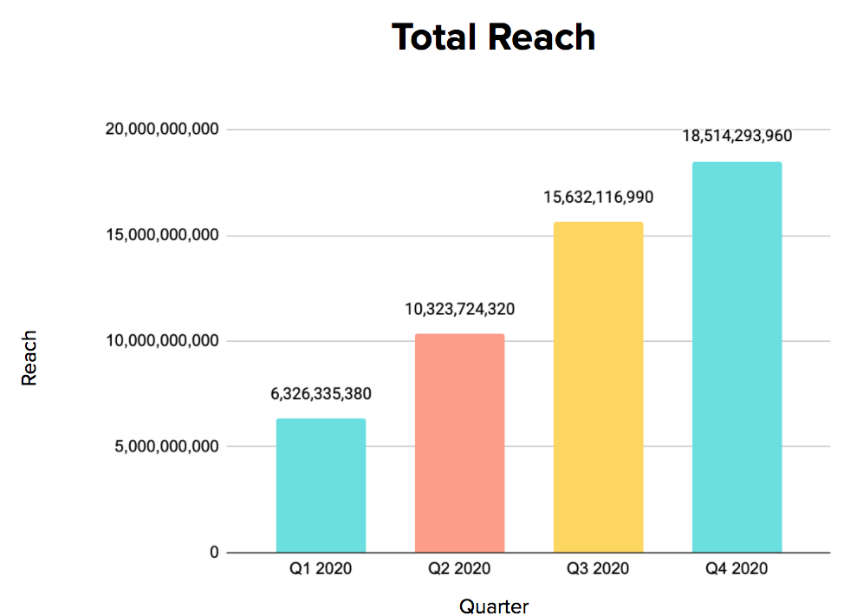
There was a consistent increase in total reach for each quarter. The number tripled in Q4, as compared to Q1.
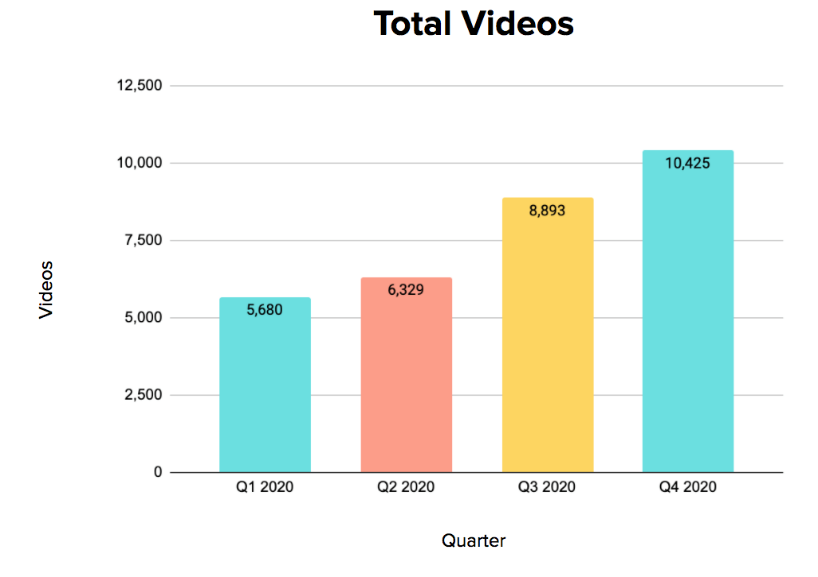
The total number of sponsored videos posted by YouTube influencers in Q4 was double of those posted in Q1.
Industry Overview – Tech
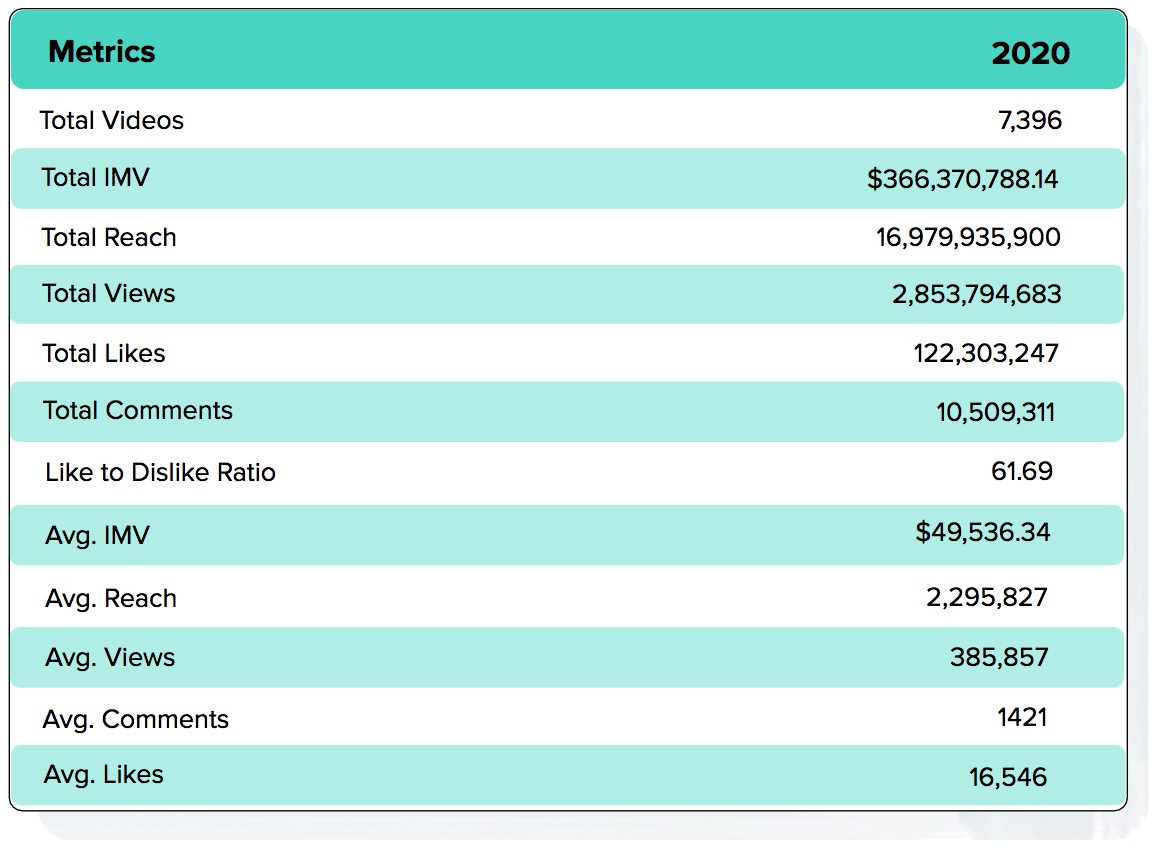
Throughout the year, the tech industry consistently held the first spot as the industry that spent the most on YouTube influencer marketing with an IMV of $336.4 million. Through 7,396 videos, the tech industry reached approximately 17B YouTubers. That’s an average reach of nearly 3.3 million per video.
If you haven’t yet capitalized on influencer marketing on YouTube in the tech space, you are missing out on a big opportunity.
Top 5 Tech Brands – By Spending on YouTube
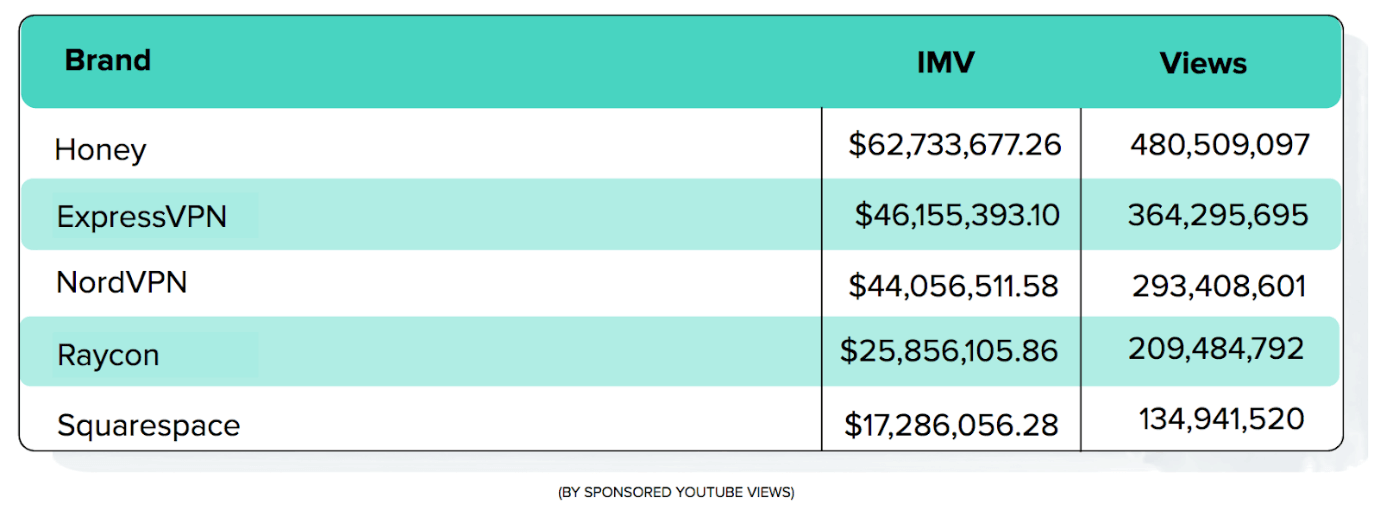
These five brands spent over $196 million—over half of the tech industry’s total IMV. With 1.5 billion views, these brands also account for over half of the views for the tech industry.
Tech Industry Quarterly Data
Looking closer at the tech industry data, you’ll see that there was a significant jump across all metrics from Q1 to Q2.
Top-Spending Tech Brand Spotlight: Honey
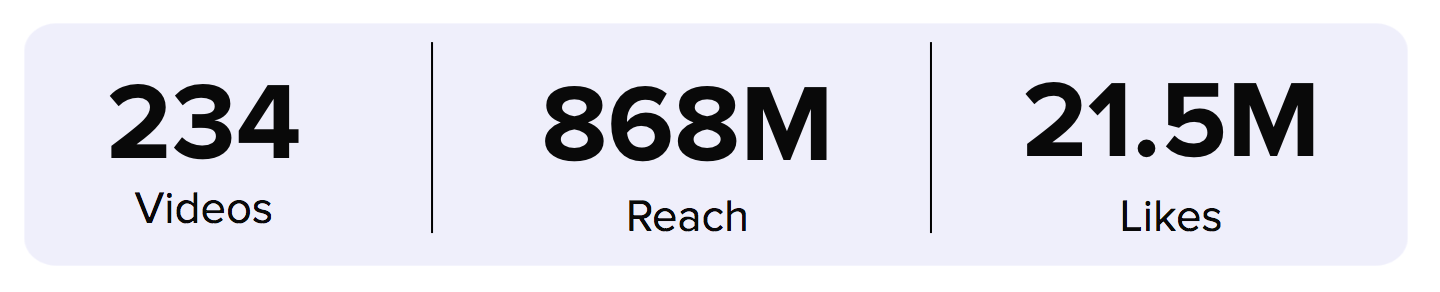
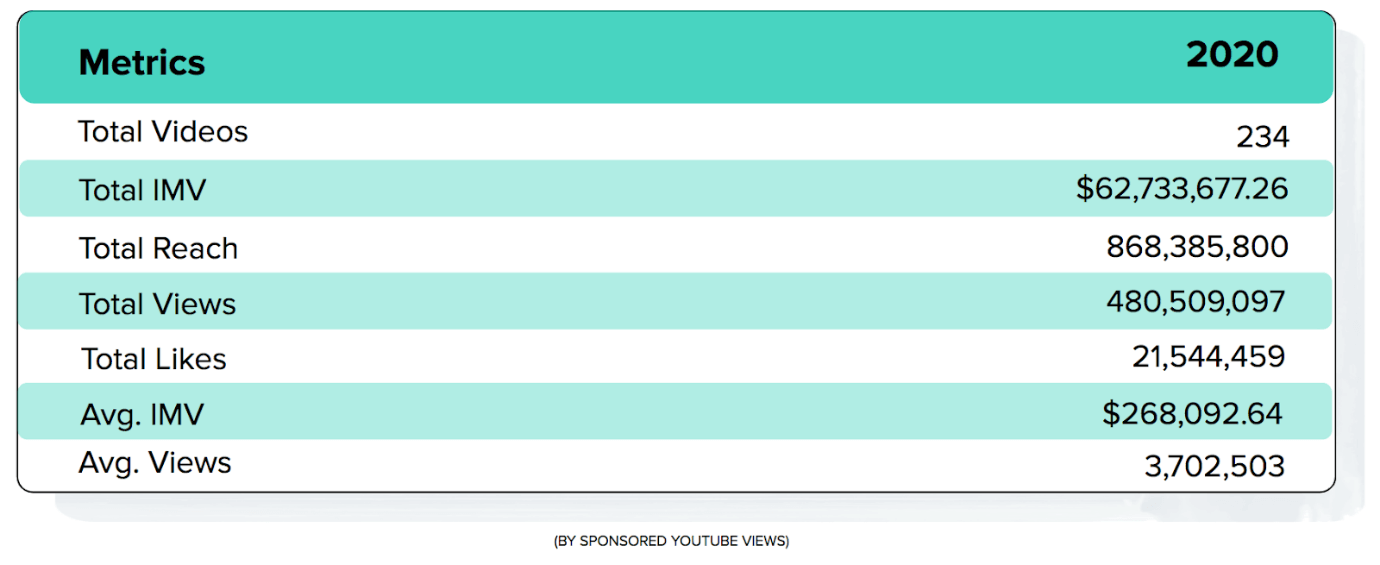
Within the tech industry, Honey was responsible for 30% of the total views. Honey contributed 17% of the total industry spend on creating 234 sponsored videos. This was the highest overall investment in YouTube influencer marketing in 2020 by any brand.
Industry Overview – Gaming
The gaming industry comes in at number two in industry rankings with a reach of over 10 billion through sponsored videos in 2020. Even though the total IMV was just half of the tech industry, the gaming industry showed impressive results.
Top 5 Gaming Brands – By Spending on YouTube
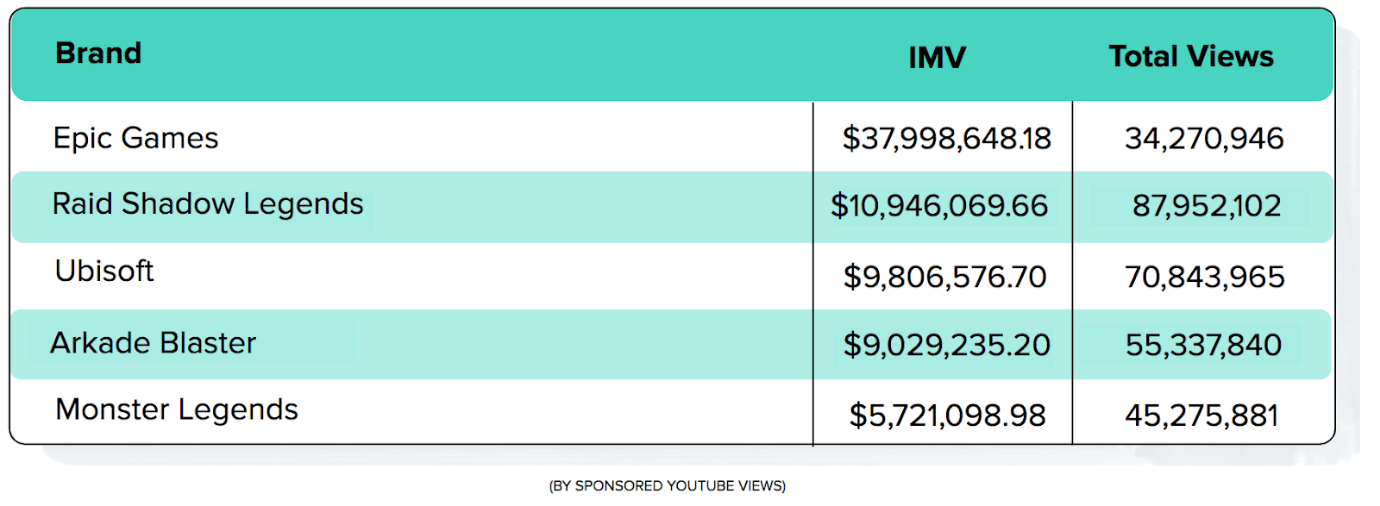
The top five highest-spending gaming brands for YouTube influencer marketing in 2020 had a total spend of $73.5M. The share of Epic Games was 52%. The brand got more than 304 million views, which is 54% of the total views received by these five brands.
Gaming Industry Quarterly Data
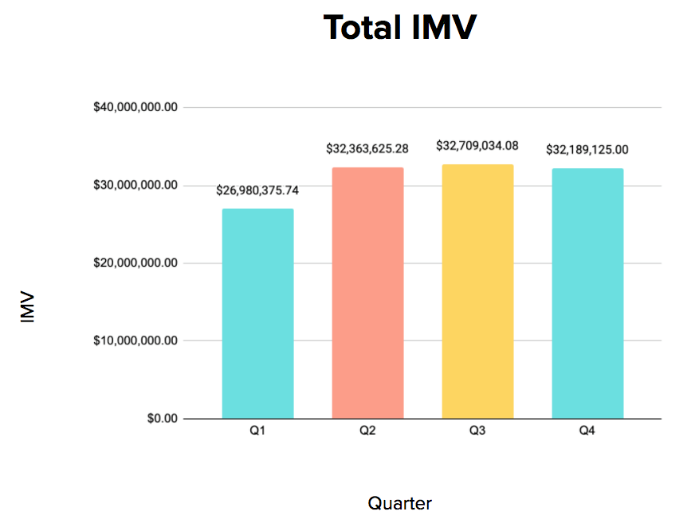
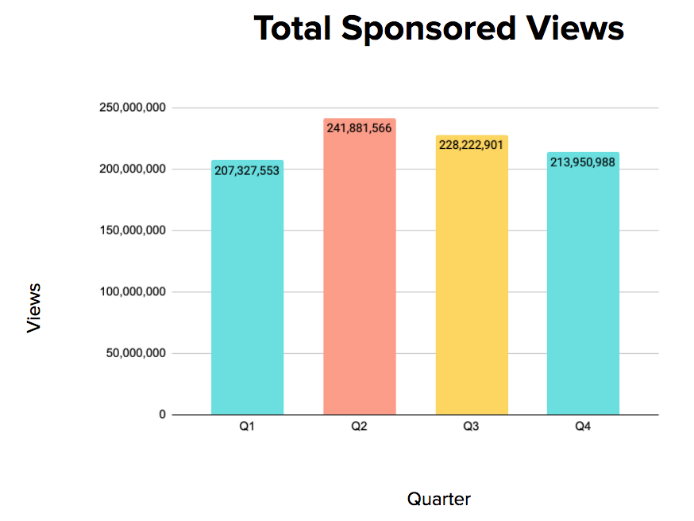
IMV for the gaming industry was steady at around the $32 million mark for the last three quarters with stable view counts between 214 million and 242 million. However, the reach did shift by almost 664 million from the first to the fourth quarter.
Top-Spending Gaming Brand Spotlight: Epic Games
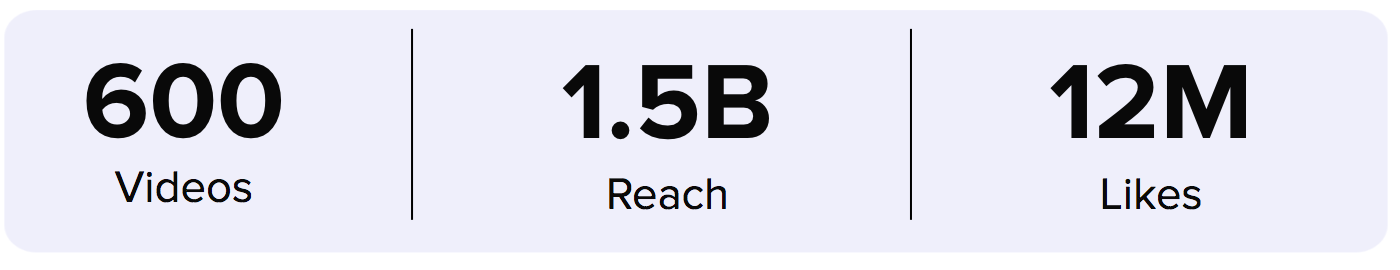
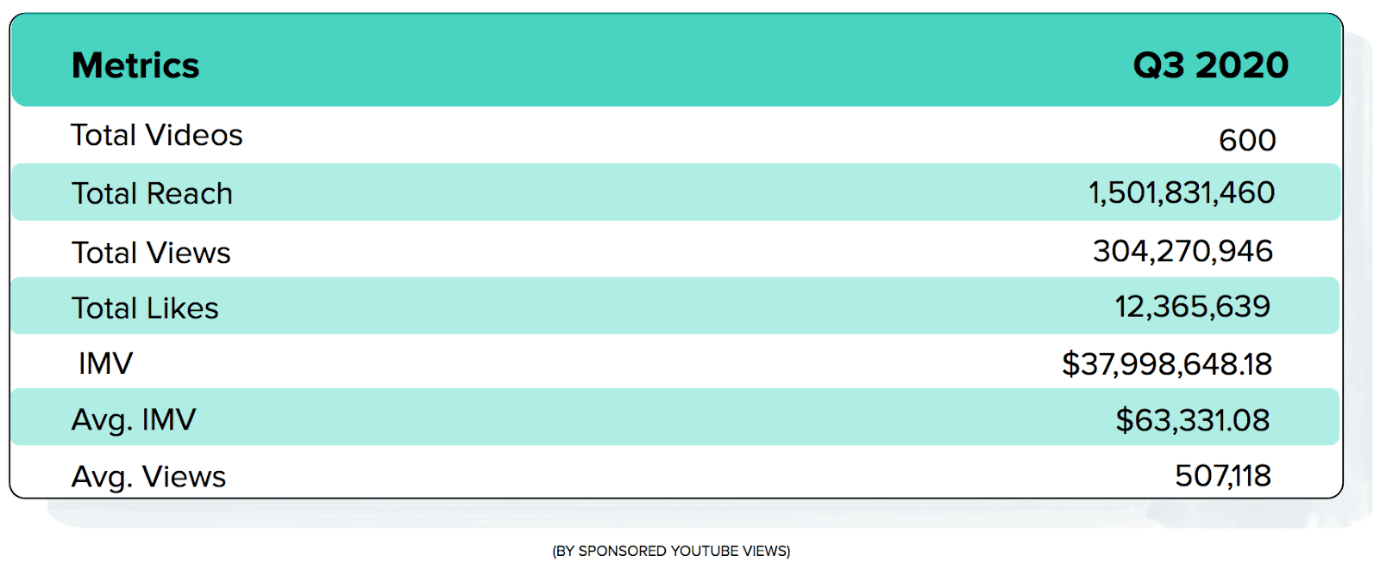
With $38M spend on YouTube influencer marketing, Epic Games was the highest-spending brand of 2020 in the gaming industry. The company reached an audience of 1.5B users through 600 sponsored videos posted by influencers.
The IMV and views for Epic Games were 30% more than the second top spender, Raid: Shadow Legends.
Industry Overview – Food & Drink
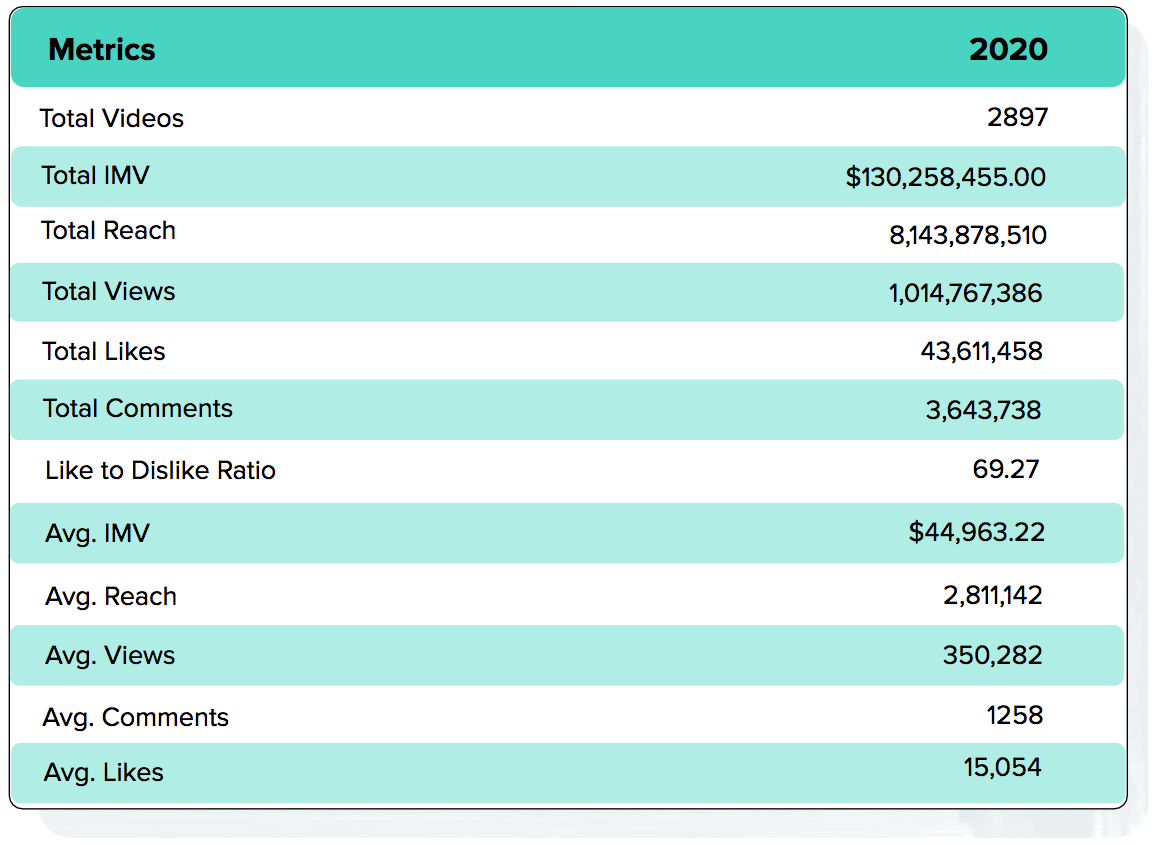
The food & drink industry spent $130 million on sponsored videos on YouTube, which is ~40% of the total spend by the tech industry. The brands were able to reach 8 billion YouTubers and got 47 million engagements by spending this amount of money.
Top 5 Food & Drink Brands – By Spending on YouTube
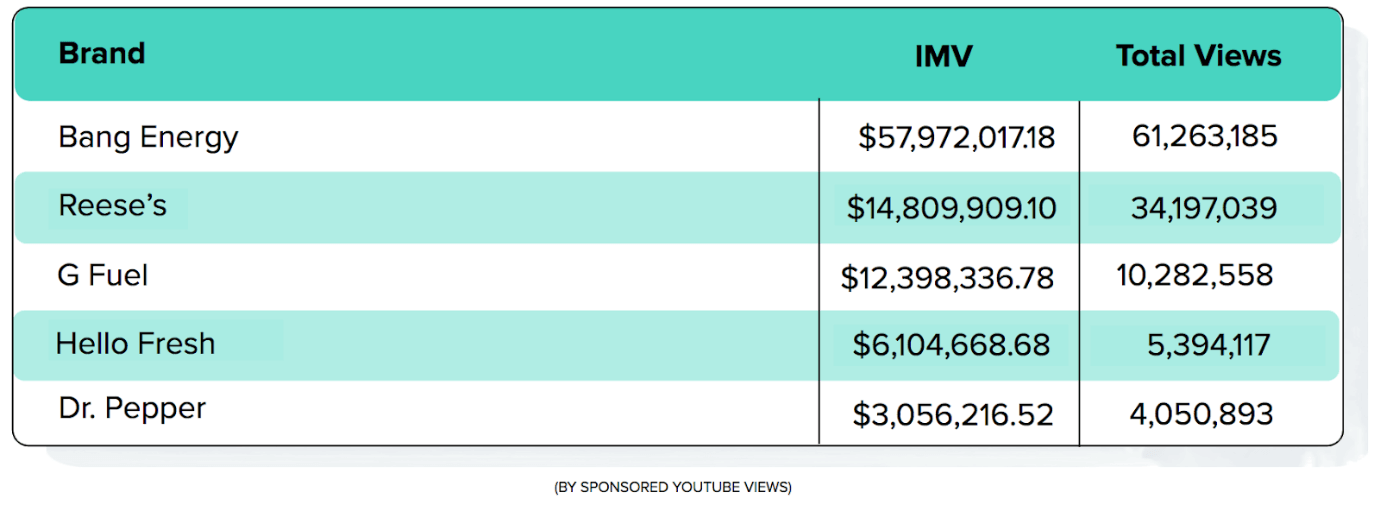
Together, the top four brands mentioned above spent over $94 million on sponsored videos, accounting for 72% of the IMV for the food & drink industry.
Food & Drink Industry Quarterly Data
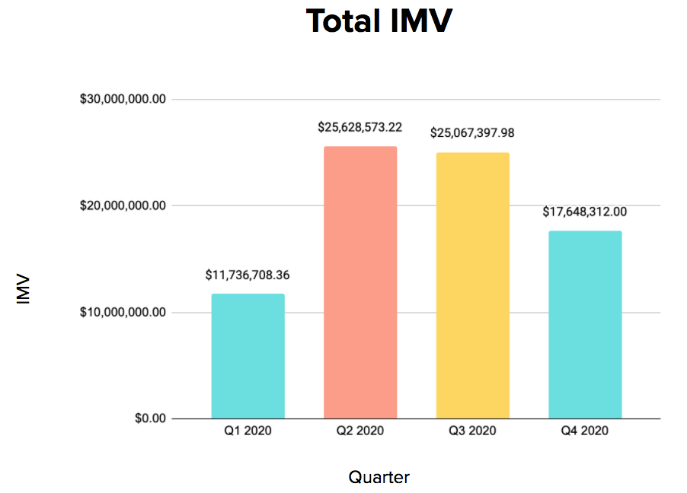
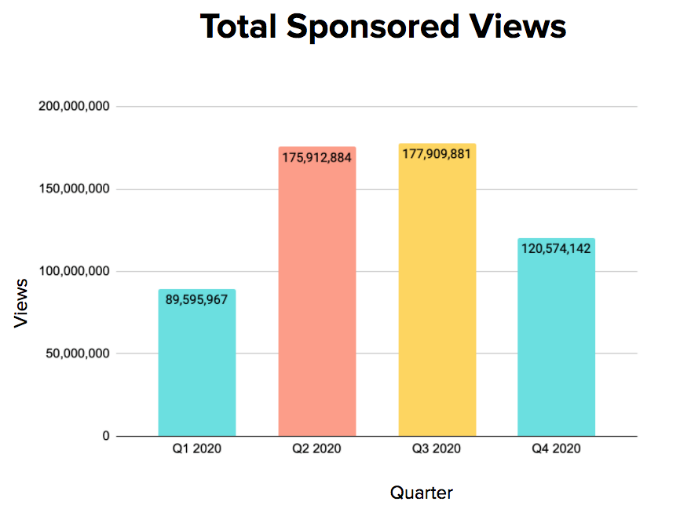
For both IMV and total sponsored views, there was an increase in Q2 and Q3, but a decrease in Q4. The highest IMV value was approximately $25 million during Q2 and Q3.
During the last three quarters, the reach was consistently in the 2 billion to 2.3 billion range, even though the number of sponsored videos doubled from Q1 to Q4.
Top-Spending Food & Drink Brand Spotlight: Bang Energy
Bang Energy reigned as the top-spending brand in the food & drink industry for three of the four quarters of 2020. By contributing only 26% of the sponsored videos, Bang Energy managed to accumulate 45% of the industry’s IMV and sponsored views.
YouTube Influencer Marketing Report: Concluding Remarks
We hope that the statistics mentioned above will convince you about the benefits of YouTube influencer marketing. So, if you are not yet investing in YouTube influencer marketing, then it’s time to do so now.
These are some of the most in-depth insights on YouTube influencer marketing that you will find.
Use these insights to design and run a viral YouTube campaign for your brand. You can use the NeoReach Social Intelligence tool to help you with that. (P.S. There’s a free version available now!)
Have any questions on YouTube influencer marketing? Feel free to leave a comment.