- Feedback vendors have a point of view: Keep that in mind when reading guides on customer feedback analysis. What they recommend may reflect what their products do.
- Who responds matters as much as response volume: A large response count from one customer group may not reflect your wider customer base.
- A clear tagging system keeps analysis consistent: Define your categories clearly so different analysts can classify the same comment in a similar way.
- Validate AI-generated themes: AI can speed up analysis, but its themes and classifications still need human review before you act on them.
- Insights need clear owners: Analysis only creates value when someone is responsible for acting on the findings and tracking the results.
Customer feedback analysis is the practice of turning surveys, reviews, support tickets, and open text into decisions your team can act on. You collect it, check who actually responded, then tag it consistently.
From there, you quantify the themes, break them down by customer segment, and trace what’s driving them. Done well, customer feedback analysis tells you what to fix first and what to leave alone.
Most teams stall well before that. The cost doesn’t stay inside your dashboard, because customers who feel unheard quietly stop answering and start leaving.
That pressure is visible in the country’s satisfaction benchmarks too. The American Customer Satisfaction Index reached a record level in Q1 2026, up 16%, with its national score at 76.7 and level with 2013.
Spending more on listening hasn’t closed that gap. That’s what makes the method worth examining. So this guide walks the process end to end: the methods, where AI breaks, how to close the loop, and how to measure the program.
Disclaimer: This content contains some affiliate links for which we will earn a commission (at no additional cost to you). This is to ensure that we can keep creating free content for you.
Table of Contents
What Is Customer Feedback Analysis?
Customer feedback analysis is the practice of examining customer comments and ratings and turning them into themes, drivers, and decisions. It spans survey results, support conversations, reviews, social posts, and call notes. The goal is to identify the issues worth fixing and assign ownership for acting on them.
Structured feedback comes as a number or a fixed choice, such as NPS, CSAT, star ratings, and scale answers. Unstructured feedback is open text that needs to be coded before you can analyze it, such as customer comments, support tickets, reviews, and call notes.
Ratings tell you whether customer sentiment has changed. Text can provide the context behind that change. That’s why the two require different approaches. While open text requires a consistent categorization procedure to find recurrent themes, rating data can be measured instantly.
The distinction is important since feedback management and analysis have different functions.
The stakes are visible in a perception gap. Medallia’s 2026 report found that 66% of CX practitioners believed customer experiences improved in the previous year, compared with just 17% of consumers.
Customer feedback analysis differs from customer feedback management.
Management is the broader program: covering feedback collection, routing, responses, and closing the loop. Analysis turns feedback into insights and actions.
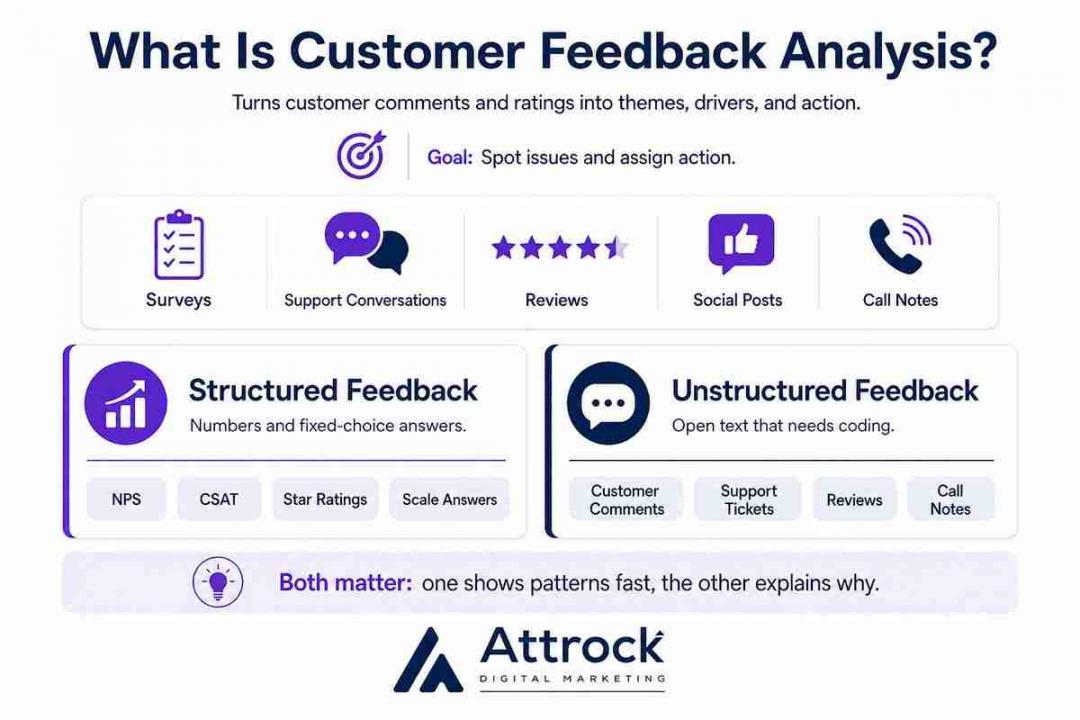
Structured feedback is already quantifiable. Unstructured feedback needs to be coded into themes before you can reliably measure it. That distinction helps determine how you analyze customer feedback.
How Does Customer Feedback Analysis Work? The 6-Step Process
The process has six steps: collect the feedback, assess who responded, categorize it using a clear taxonomy, quantify the themes, identify the drivers, and summarize the findings. Each step turns raw feedback into insights the team can act on. Skipping a step can affect the accuracy of everything that follows.
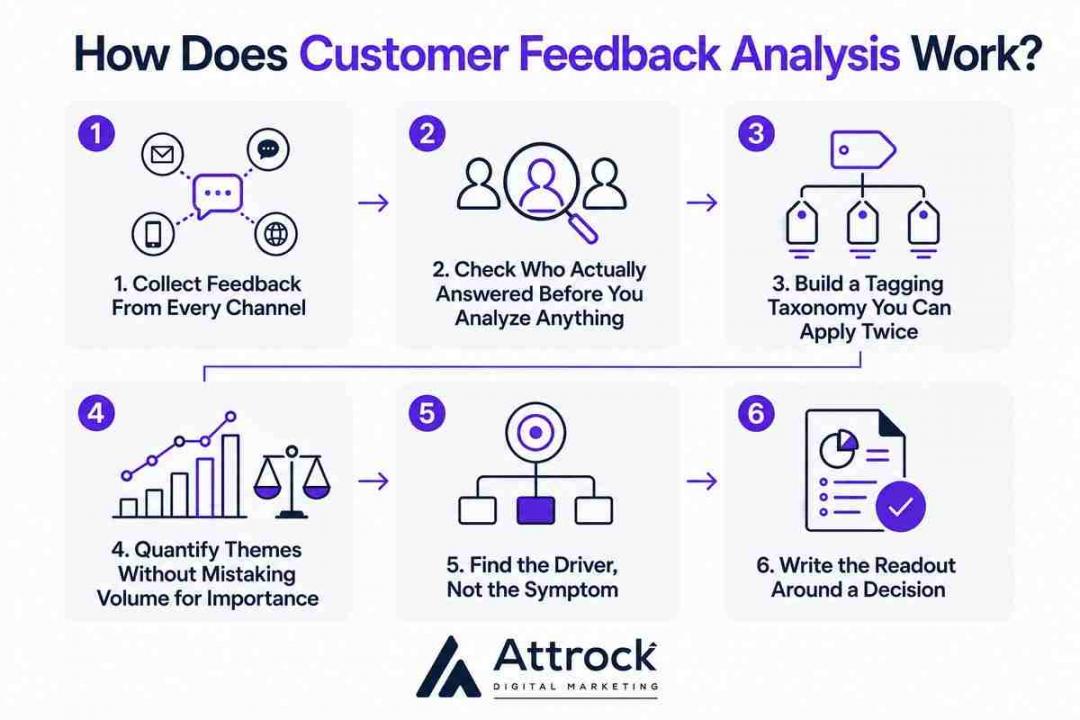
Step 1: Collect Feedback From Every Channel
Step one is to map where your customer feedback comes from before you analyze it. This can include surveys, support tickets, online reviews, social posts, in-product prompts, and sales or customer success calls. The aim is to capture feedback from all key customer touchpoints.
Qualtrics XM Institute’s 2025 research found most consumers stay silent after a bad experience. Only 29% said they tell the company about it. That’s down 7.5 points since 2021.
Adding social listening can surface complaints that never reach your support queue. Customers who respond may not represent your entire customer base, so consider who is missing from the feedback.
One option is to run surveys within the system where customer records already live, making it easier to connect feedback with customer context. HubSpot handles NPS, CSAT, CES, and custom surveys through Feedback Surveys under Service, with responses attached to the contact and company records. If verified against the current HubSpot documentation, Feedback Surveys are available on the Service Hub Professional and Enterprise plans.
Step 2: Check Who Actually Answered Before You Analyze Anything
Step two is to check who responded before analyzing the feedback. Nonresponse bias happens when the people who reply are different from those who stay silent. Compare your respondents with your wider customer base before treating any theme as reliable.
Pew Research Center’s 2026 methodology report recorded a survey-level rate of 93% on American Trends Panel Wave 177. After accounting for recruitment nonresponse and panel attrition, the cumulative rate was 3%.
That gap shows what even careful sampling can miss. Closed and open-ended questions also get different response rates, so separate structured and unstructured data before analyzing them.
Step 3: Build a Tagging Taxonomy You Can Apply Twice
A tagging taxonomy uses simple categories and rules to organize open-text feedback into themes you can count. The parent theme covers the main topic, such as Onboarding, while the child code identifies a specific issue, such as SSO setup failed.
This hierarchy lets you report broad trends while still seeing the problems behind them. Define both before formal tagging, then refine them if testing shows that the rules are unclear.
Each code should clearly explain what is included and, when helpful, what is not. This extra detail makes it easier for two analysts to use the same code in the same way on the same text.
Start by reviewing a representative sample of verbatims before naming your codes. For a larger dataset, reviewing 100 to 200 comments can give you enough variety to identify recurring themes.
Group comments that describe the same underlying issue, even when customers use different words. Keep the number of parent themes manageable, and create child codes only when the distinction changes what the team should do.
The table below shows how to structure a customer feedback taxonomy. Adapt the themes, codes, and inclusion rules to your product.
| Parent theme | Child code | What counts | What does NOT count |
|---|---|---|---|
| Onboarding | SSO setup failed | Customer could not complete single sign-on configuration | General login failures after setup succeeded |
| Onboarding | Data import blocked | Import tool errored, timed out, or rejected the file | Customer chose not to import; feature requests for new formats |
| Billing | Unexpected charge | Customer disputes an amount they did not expect | Customer understands the charge but finds it too high |
| Billing | Plan limits unclear | Customer hit a cap they did not know existed | Requests to raise a cap the customer already understood |
| Support | Slow first response | Customer names wait time before any human replied | Complaints about the answer’s quality once it arrived |
| Product | Missing integration | Customer names a specific tool they cannot connect | Vague requests for “more integrations” with no tool named |
Test the taxonomy on a small sample before scaling it. Have two people tag the same set of comments independently, then compare where they disagree.
If the same comments repeatedly receive different codes, tighten the definitions before tagging the full dataset.
Step 4: Quantify Themes Without Mistaking Volume for Importance
This step counts how often each code appears. Then compares those counts across groups like plan level, length of time, revenue range, and sales stage.
Frequency alone tells you what’s common. Segmenting those results shows which customer groups experience each issue most often.
Volume isn’t importance. A theme raised 400 times by trial users may matter as much as one raised 12 times by your largest accounts if it is blocking conversion. Consider frequency alongside customer value and business impact.
Map themes onto your ecommerce conversion funnel, or your equivalent, to see which issues affect key conversion stages. Prioritize them alongside their frequency, severity, and business impact.
Step 5: Find the Driver, Not the Symptom
Step five is about separating symptoms from drivers. Symptoms are what customers talk about, such as slow support. Drivers are the factors linked to outcomes such as satisfaction or retention. Key-driver analysis helps rank these factors based on how strongly they relate to the outcome. Often, the symptom and the driver are not the same.
Root cause work goes further, tracing a theme back to the process producing it. Keep asking why until you find a cause the team can act on.
Slow support might trace to ticket routing, and routing to a staffing model nobody revisited. The staffing model may be the root cause; the analysis can then show whether support speed is a meaningful driver of the customer outcome.
A driver explains what is associated with the outcome; a root cause explains why the underlying problem exists. They can overlap, but they are not the same thing.
Step 6: Write the Readout Around a Decision
In step six, take your tagged and measured findings and turn them into a summary that helps people make decisions. Say who the audience is, what decision they should make, and show the evidence that supports it. Then, share your recommendation. For each main theme, include its size, the segment it belongs to, and who is responsible for it.
I’d rather ship four themes with owners attached than twenty ranked by mention count.
Done properly, the work ends with a scheduled change rather than a slide.
Gather feedback from every source. Check who has responded, label each reply clearly, and sort them into groups. Identify the main reasons, then write a summary that focuses on one decision. Double-check each step to avoid mistakes that could affect the next.
Which Customer Feedback Analysis Methods Should You Use and When?
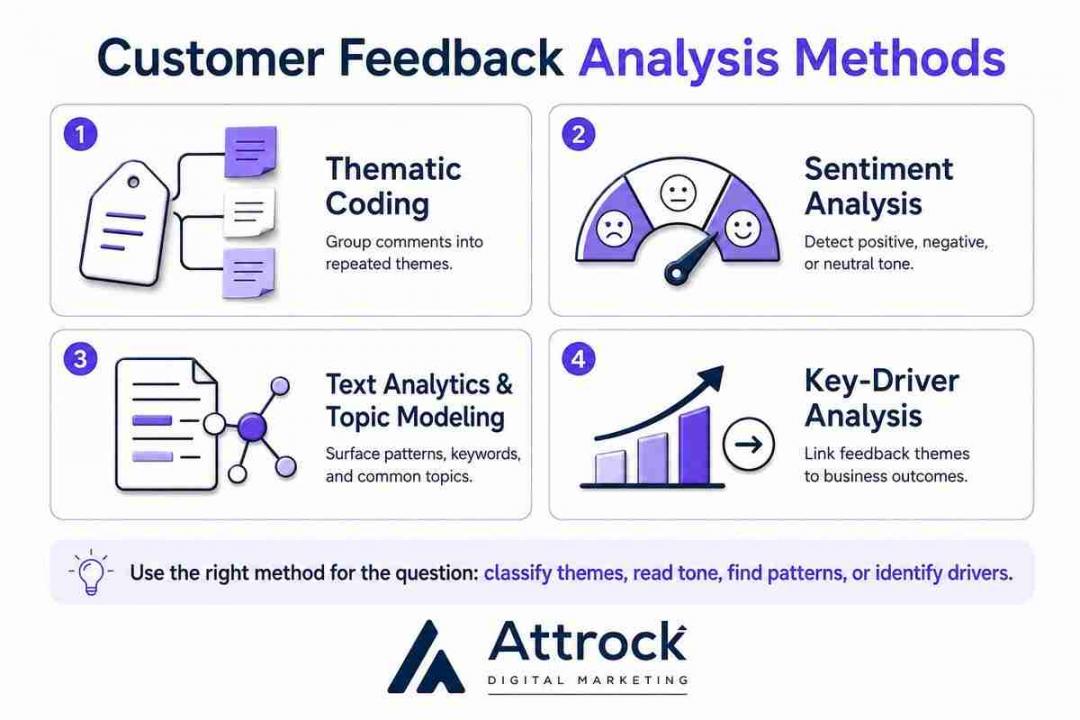
Four customer feedback analysis methods cover almost every question teams ask: thematic coding, sentiment analysis, text analytics with topic modeling, and key-driver analysis. Pick by the shape of your data and the decision you face, not by what’s fashionable.
Thematic coding. A human or a model assigns open-text comments to categories in your taxonomy, using the themes and coding rules you agreed to. Use it to identify recurring issues, needs, and themes in customer feedback.
A peer-reviewed 2026 Public Opinion Quarterly study found that frontier models could achieve F1 scores above 0.8 when classifying open-ended survey responses against expert coding. The study also found that the evaluation method affected how closely model outputs matched expert judgments.
Next comes sentiment analysis. Sentiment analysis of customer feedback labels text as positive, negative, or neutral. This makes it helpful for filtering and spotting trends, but it should not be used as a diagnosis.
It shows how customers feel but doesn't explain why.
Text analytics and topic modeling identify recurring patterns in language across a corpus, which is useful when your categories are not yet clear.
Machine learning can help automate some of this analysis. This is especially helpful when there is too much feedback, or it comes in too often for people to review by hand.
Key-driver analysis examines the relationship between coded themes and a score or business outcome, then ranks factors by the strength of their association. It ranks association, not cause, so treat the strongest associations as hypotheses to investigate rather than proof of causation.
Metrics need scrutiny too. A peer-reviewed study published in 2026 followed ski resorts over time and found that NPS had a statistically significant but weak connection to future visits. It also performed no better than a standard satisfaction measure.
NPS explained roughly 4% of the variance in visits in that study. That makes it useful for tracking, but not enough to diagnose why customers behave the way they do.
Below is how I’d choose between these customer feedback analysis techniques.
| Method | Use it when | What it cannot tell you | Data it needs |
|---|---|---|---|
| Thematic coding | You need to identify recurring themes and issues in customer feedback | Whether a theme is associated with revenue or retention | Open text plus an agreed taxonomy |
| Sentiment analysis | You want a filter or a trend line across a large volume of text | Why sentiment moved or which specific issue needs fixing | Open text; becomes more useful as response volume increases |
| Text analytics and topic modeling | You do not yet know what your categories should be | Whether the groups it finds map to decisions anyone owns | A sufficiently large corpus with enough variation to identify recurring patterns |
| Key-driver analysis | You need to know which themes are most strongly associated with a score or outcome | What customers mean by the theme, in their own language | Coded themes joined to a score or business metric across enough observations |
Match the method to the question. Thematic coding shows what customers discuss, key-driver analysis shows what moves your score, and sentiment analysis of customer feedback is only a filter.
Where AI Customer Feedback Analysis Falls Short
AI customer feedback analysis is worth using and worth checking. It can fail when the same input produces different results, when ordinary language is misread, or when tags have not been validated. To gauge how accurate AI text analysis is, start with repeatability. Accuracy is the second question.
The Same Verbatim Can Score Differently on Every Run
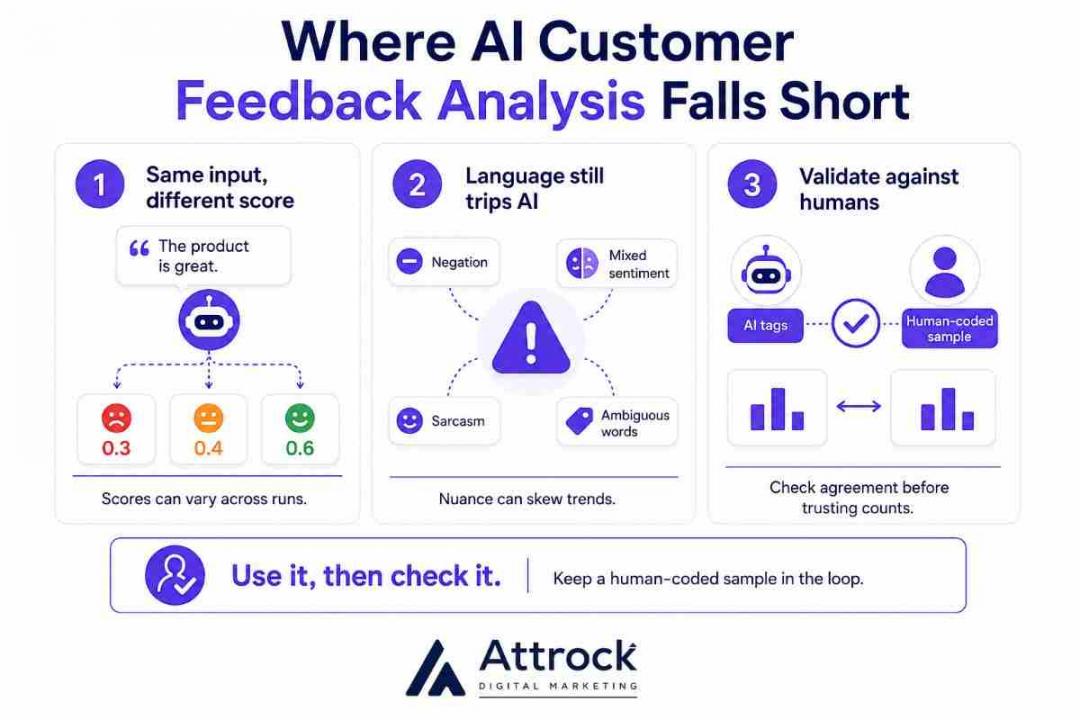
Large language models can return the same sentiment scores for the same text across runs. Herrera-Poyatos et al. re-scored one review 100 times in a 2025 arXiv preprint, and the scores fluctuated between 0.3 and 0.6. Nothing about the review changed.
So never report an AI sentiment score as precise. Fix the model version, prompt, and relevant generation settings before comparing periods, or you risk comparing noise.
Here’s what one verbatim does under repeated scoring.
Sarcasm, Negation, and Mixed Sentiment Still Break Scoring
AI sentiment scoring can still misread ordinary phrasing. Negation can be difficult to interpret, as in ‘not bad at all.’ Mixed sentiment in one line, like ‘fast delivery, broken product,’ can also be reduced to a single overall score. Sarcasm and product names that double as everyday words can add further ambiguity.
These errors aren’t evenly distributed. They can cluster around feedback containing irony, negation, or ambiguous language, distorting sentiment trends for particular customer groups or topics.
If your angriest customers are also the most sarcastic, some of that feedback may be classified as neutral or even positive.
How to Validate AI Tagging Against a Human-Coded Sample
Validating AI tagging takes a sample, not a rebuild. Pull a random sample of the AI’s tagged verbatims, then have a person code the same set blind to the model’s labels. Compare the labels and measure how consistently the human and AI agree.
Where you disagree matters more than how often. Disagreement clustered in one theme can indicate an ambiguous code definition, but it can also show where the model struggles with that type of feedback.
Run this check before treating AI-generated theme counts as reliable findings.
None of this makes AI a bad choice for customer feedback analysis. At higher volumes, it can be a practical way to speed up coding, as long as you validate the results.
My position is narrower: use it, then check it. Because AI outputs can vary, keep a human-coded sample in the loop.
It’s accurate enough to scale coding, and too unstable to quote precisely. Fix the model version, validate tags against a human-coded sample, and read sentiment scores as ranges.
How to Close the Customer Feedback Loop?
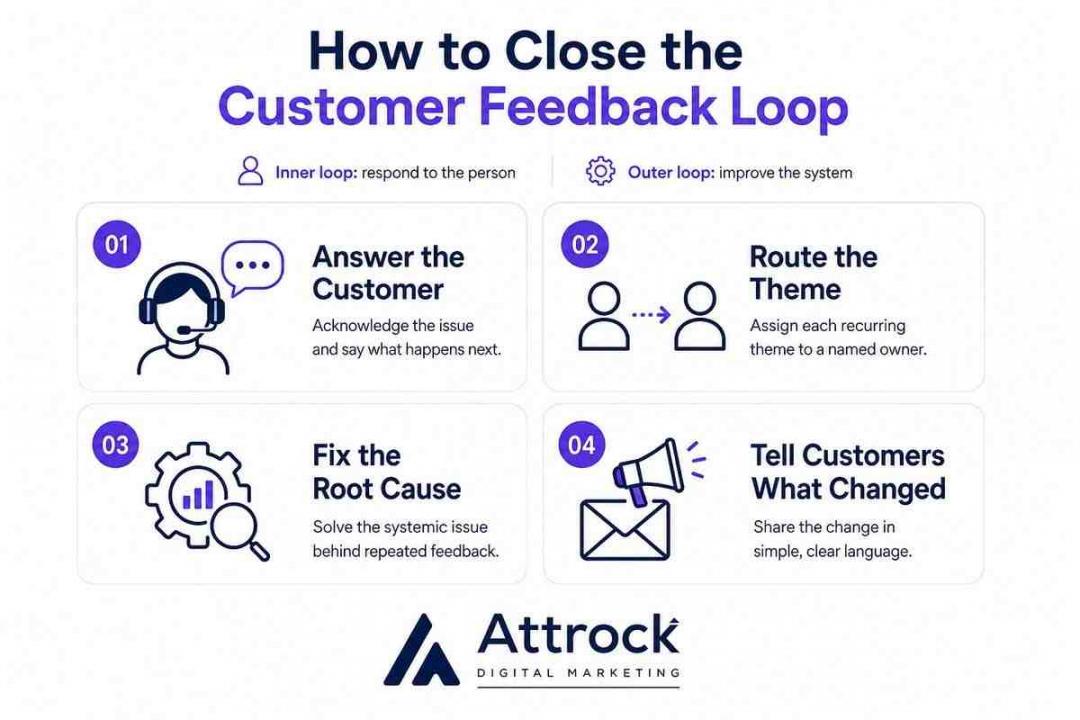
Closing the customer feedback loop means running two loops at once. The inner loop is your response to the person who raised the issue. The outer loop turns recurring feedback into changes to the product, process, or experience. Many teams handle individual responses but fail to act on the wider pattern.
Medallia’s 2026 State of Customer Experience report found that 30% to 40% of departments take no action after receiving customer feedback. That suggests many organizations still struggle to turn feedback into broader changes.
Stage 1: Answer the Customer Who Raised It (the Inner Loop)
The inner loop starts with a timely reply from a named person who acknowledges the issue and explains what happens next. A short acknowledgment naming the issue beats a polished response nobody sends.
Use a monitored inbox and give a date. Use recent feedback to respond while the issue is still relevant. The goal is to be timely without sacrificing clarity.
Stage 2: Route the Theme to a Named Owner
A theme with no owner doesn’t get fixed. Assign each recurring theme to a named owner, even when a department will carry out the work, and set a clear timeframe for the handoff.
For example, you might allow two working days to acknowledge the issue and one review cycle to decide what to do. Adjust those targets to your team and feedback volume.
Route from wherever the response already lives, so nothing gets rekeyed elsewhere.
Stage 3: Fix the Systemic Cause (the Outer Loop)
The outer loop addresses the underlying cause so the same complaint occurs less often. Key-driver analysis can identify themes strongly associated with the outcome you want to improve. Prioritize those themes alongside their frequency, severity, and business impact.
The underlying cause may sit in a process, product, policy, training, or other part of the customer experience.
The driver analysis from earlier helps identify which themes deserve closer attention.
Stage 4: Tell Customers What Changed
A ‘you asked, here it is’ message shows customers how their feedback influenced a change. Tell the people who raised it what shipped, in plain words. Name the change, not the process behind it. Showing customers what changed can reinforce that their feedback is being heard and acted on.
A saved segment plus marketing automation software makes that update a triggered follow-up.
Answer the individual quickly, route the theme to a named owner, fix the cause behind it, then tell customers what changed. Doing one without the other leaves the same complaint in your queue next quarter.
Which Customer Feedback Analysis KPIs and Governance Practices Should You Use?
Customer feedback analysis needs its own scoreboard, separate from the one you keep on customers. NPS measures willingness to recommend, CSAT measures satisfaction with an interaction or experience, and CES measures how easy or difficult it was to complete a task or resolve an issue
None directly tells you whether the feedback programme is working or who owns it. Teams should also check whether the open text feeding their models contains personal or sensitive information that needs protection.
The KPIs That Measure the Program Itself
Six metrics show whether the feedback program is operating effectively. Three measure how well you analyze the feedback; the other three measure whether those insights lead to action. Three measure the quality and speed of analysis.
The other three measure whether those insights lead to action. Track both sets, or you’ll optimize the easier half and call the program healthy.
Coverage rate, time to insight, and inter-coder agreement measure the reading. Loop-closure rate, insight-to-change conversion, and backlog age measure the acting.
The targets below are where I’d start, not industry benchmarks. Nobody publishes those.
| Metric | Formula | Suggested starting target |
|---|---|---|
| Coverage rate | Feedback items tagged / feedback items received | 90% or higher per channel |
| Time to insight | Days from feedback arriving to it appearing in a readout | Under 30 days for themes |
| Inter-coder agreement | Matching labels/labels checked | 80% or higher on a blind sample, as a starting target |
| Loop-closure rate | Customers who got a reply/customers who raised an issue | 80% or higher for the inner loop |
| Insight-to-change conversion | Accepted insights that led to a documented action / accepted insights | 30% or higher per quarter |
| Insight backlog age | Median days an accepted insight has waited unshipped | Under 90 days |
Who Should Own Customer Feedback Analysis
Ownership often spans CX, product, support, and research, which can make accountability unclear. A simple model is to assign three responsibilities: an owner for the taxonomy, one for triage, and a decision-maker for what ships. In smaller teams, one person may hold more than one role. Clear ownership matters more than adding another analysis tool.
Privacy and Compliance on Feedback Data
Open-text feedback, the verbatims customers write themselves, can contain names, order numbers, and complaints naming individual staff. If your privacy needs necessitate it, reduce or redact personal information before analyzing it.
Once a verbatim goes to a third-party model, another data processor is involved. Check the privacy, security, contractual, and retention requirements before sending it.
The EU AI Act prohibits certain AI systems used to infer people's emotions in workplaces and educational institutions, subject to limited exceptions. Article 5 (1)(f) has applied since 2 February 2025.
It applies to certain workplace and education uses, not ordinary customer feedback analysis. Whether a particular sentiment or emotion system falls within the prohibition depends on how the AI system is used.
Redaction is a pipeline step, not just a policy. Build it into the point where feedback is prepared for analysis or sent to an external system.
Track coverage, time to insight, inter-coder agreement, loop closure, and how many insights ship as changes. Then give the taxonomy, the triage, and the decision each a named owner, and treat privacy as part of that same job.
FAQ
Q1. What are the best methods of obtaining feedback from customers?
A. Surveys, support tickets, online reviews, user interviews, and in-product prompts cover several common ways to collect customer feedback. Surveys give you comparable numbers over time.
Tickets and reviews usually come in without being asked for, and they often reflect the views of customers who have had issues. Interviews help explain the reasons behind a score, and in-product prompts gather feedback while the experience is still fresh.
Q2. How do I build a tagging taxonomy from scratch?
A. Start by reading 100 to 200 verbatims before finalizing your codes. Note recurring language and group it into six to ten parent themes.
Only add child codes if making the distinction would actually affect someone's actions. Clearly define what is included and excluded for each code. After your first round, review and combine codes as needed.
Q3. How do you measure customer feedback?
A. Measure feedback on two core dimensions: volume and impact. Volume shows how often a theme appears, cut by segment so one group doesn’t dominate the count. Impact shows how strongly a theme is associated with a score or outcome you care about, such as renewal. NPS, CSAT and CES summarise customer responses; they don’t explain the reasons behind them.
Q4. What is the 5-point customer satisfaction scale?
A. Customers are asked to rate their level of satisfaction on a 5-point scale, with labels determined by the survey, ranging from 1 to 5. Many use 1 for very dissatisfied and 5 for very satisfied. You can report the mean, but also show the share choosing the top two options to make the distribution easier to interpret.
Q5. What should a customer analysis include?
A. Describe who your customers are, what they do, and what they say. List customer segments, important behaviors like purchases or product use, common feedback themes and how often they come up, and what drives outcomes such as renewals. Finally, state which decision this analysis will support, so it does not get overlooked.
Q6. How much customer feedback do I need before a theme is trustworthy?
A. Always trust a theme when it stays consistent, not when it reaches a set number. Feedback should be added in batches and rankings should be checked after each one.
When new batches stop bringing up new themes and the main themes stay consistent, you have enough confidence to act. Give small segments extra attention.
Q7. Can I automate customer feedback analysis with ChatGPT?
A. Yes for a first pass, no for a number you plan to report without checking. General models can draft a code frame quickly and group similar comments well.
Their results can also change each time. Check the output against a sample coded by a person, and remove or reduce any personal information before sending the exact text.
Q8. How often should I run customer feedback analysis?
A. A good starting plan is to watch for alerts all the time, check for common issues every month, and review main causes every three months. Change how often you do this based on how much feedback you get and how fast the experience changes.
Review individual complaints promptly. Review the taxonomy quarterly, alongside your driver analysis.
Q9. Who should own customer feedback analysis in a company?
A. One accountable owner should oversee the program, with three clear responsibilities:
- Taxonomy: Owns the categories and coding rules.
- Triage and routing: Reviews feedback and sends it to the right team.
- Decision-making: Decides which feedback leads to product or process changes.
The owner can sit in CX, product, or support. What matters is having one person accountable for the program.
Conclusion
Customer feedback analysis helps turn raw responses into clear decisions with an owner. The steps are simple. Collect feedback, see who responded, and tag each comment using clear categories. Then count the main themes, find the biggest drivers, and write a clear summary.
Start with your last round of feedback. Check who answered and who didn’t, then read a sample of the verbatims before building your tagging taxonomy.
The short version of customer feedback analysis
Collect widely, check who answered, tag with defined codes, quantify by segment, then identify the strongest drivers and name an owner for the action.
That usually shows whether your problem sits: data quality, analysis, or ownership. If you’d rather work through it with someone, book a session with me.
If collection is the piece that’s broken, HubSpot Service Hub can help you collect feedback and connect responses with customer records.
Disclaimer: This content contains some affiliate links for which we will earn a commission (at no additional cost to you). This is to ensure that we can keep creating free content for you.