- Marketing ROI measures profit generated against campaign costs. Express it as a ratio or percentage, not raw revenue.
- Calculating ROI takes seconds, but attributing revenue to specific marketing efforts is where teams struggle.
- There’s no universal benchmark for marketing ROI. The popular 5:1 ratio doesn’t have enough data to back it up. This is why targets based on it is considered arbitrary.
- Your number is an estimate. Tracking limits, attribution models, and window settings affect your final marketing ROI calculation.
- Incrementality testing is what separates a defensible number from a flattering guess.
Marketing ROI is the profit generated by a marketing activity in relation to its cost. The formula is simple. The inputs are where teams struggle. Understanding which costs, revenue sources, and attribution methods to include is what separates a useful ROI calculation from a misleading one.
Nielsen’s 2025 Marketing ROI Blueprint found 85% of marketers are extremely confident measuring marketing ROI across all channels. However, only 32% actually do it.
This gap shows where the problem lies. Most teams report a number they can’t defend when finance asks the hard questions.
This guide bridges that gap. We’ll walk through core marketing ROI formulas with step-by-step examples and debunk popular benchmark myths. You’ll also learn how to select the right attribution model.
Let's look at how revenue flows from initial spend to final attribution.
Disclaimer: This content contains some affiliate links for which we will earn a commission (at no additional cost to you). This is to ensure that we can keep creating free content for you.
Table of Contents
What Is Marketing ROI?
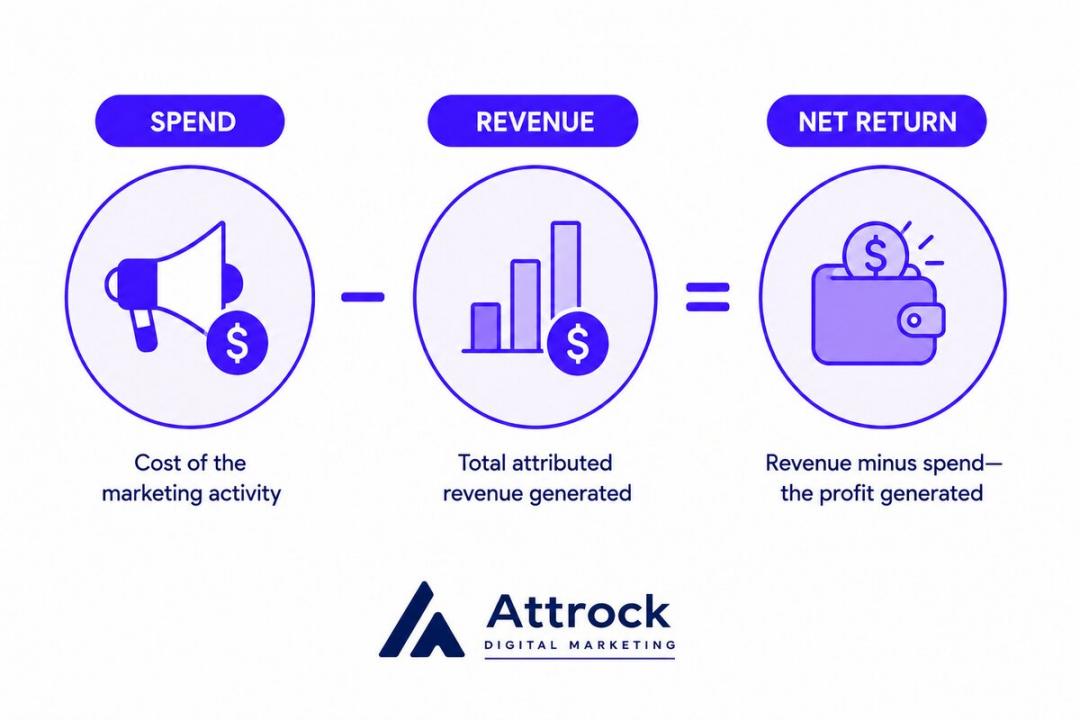
Marketing ROI, referred to as MROI or ROMI, is a metric that measures the profit a marketing activity generates relative to its cost. Expressed as a percentage or a ratio, it subtracts investment from attributed return and divides by that investment.
For example, if you get a result of 275%, this means the campaign returned $2.75 in profit for every dollar spent.
What does ROI mean in marketing? It answers the question every CFO eventually asks: Did the spend generate relatively more money?
Marketing ROI is often calculated inconsistently across the industry. Some teams use gross margin in the numerator to account for product costs. Others simply use total incremental revenue.
Because these terms and formulas are used interchangeably, published figures are often not directly comparable.
To clear up this confusion, the image below breaks the calculation down into its three core components: spend, revenue, and net return.
What Counts as Return and Investment
Return is the revenue or margin you can attribute to your marketing effort. Investment is the cost required to produce the results.
Before coming up with these numbers, choose between campaign ROI and marketing-function ROI.
This choice changes the denominator, so it changes the final marketing ROI. Campaign ROI counts one activity’s cost. Function ROI counts the whole budget.
Here are the costs to be settled before you begin calculating:
| Cost Category | Campaign-Level ROI | Function-Level ROI | How Often It’s Missed |
|---|---|---|---|
| Direct Ad Spend and PPC | Yes | Yes | Rarely |
| Agency and Freelance Fees | Yes | Yes | Often, on retainer work |
| Software and Platform Subscriptions | No | Yes | Often, when billed centrally |
| Allocated Internal Salaries | No | Yes | Almost always |
| Content Production | Yes | Yes | Often, when produced in-house |
| Creative and Design | Yes | Yes | Sometimes, when shared with brand |
Where the boundary sits determines which costs land in the marketing ROI calculation.
Simply put, marketing ROI tells you how much profit each dollar of marketing spend has returned, after that spend is subtracted. A positive figure means your marketing efforts are producing positive results.
How Do You Calculate Marketing ROI?
To calculate marketing ROI, take your attributed revenue, subtract cost, then divide by that same cost.
Marketing ROI = (Attributed Revenue – Marketing Cost) / Marketing Cost
To calculate the percentage, multiply the result above by 100.
Marketing ROI % = [(Attributed Revenue – Marketing Cost) / Marketing Cost] x 100
Variables of the Marketing ROI Formula
The marketing ROI formula uses two main figures: attributed revenue and marketing cost. They sound straightforward, but the real challenge is deciding what should be included.
For example, should employee salaries count as a marketing cost? What about agency retainers? When measuring returns, should you use gross revenue or gross profit?
Answering these questions before you start calculating helps keep your results accurate and consistent.
Here’s how each variable is defined, sourced, and where calculations commonly fail:
| Variable | What It Means | How You Source It | Where It Goes Wrong |
|---|---|---|---|
| Attributed Revenue | Total sales credited to marketing efforts | CRM, using your chosen attribution model | Wrong model choice can move it over or under by half |
| Marketing cost | Cost to earn that revenue | Finance ledger and platform billing | Salaries and retainers get left out |
| The Ratio (Output) | Net profit generated per dollar spent (e.g., 3:1) | Calculated, not reported | Gross revenue used instead of gross profit |
| The Percentage (Output) | The ROI ratio expressed as a percentage (e.g., 300%) | Calculated | Quoted without saying which variant produced it |
Example of a B2B Marketing ROI Calculation
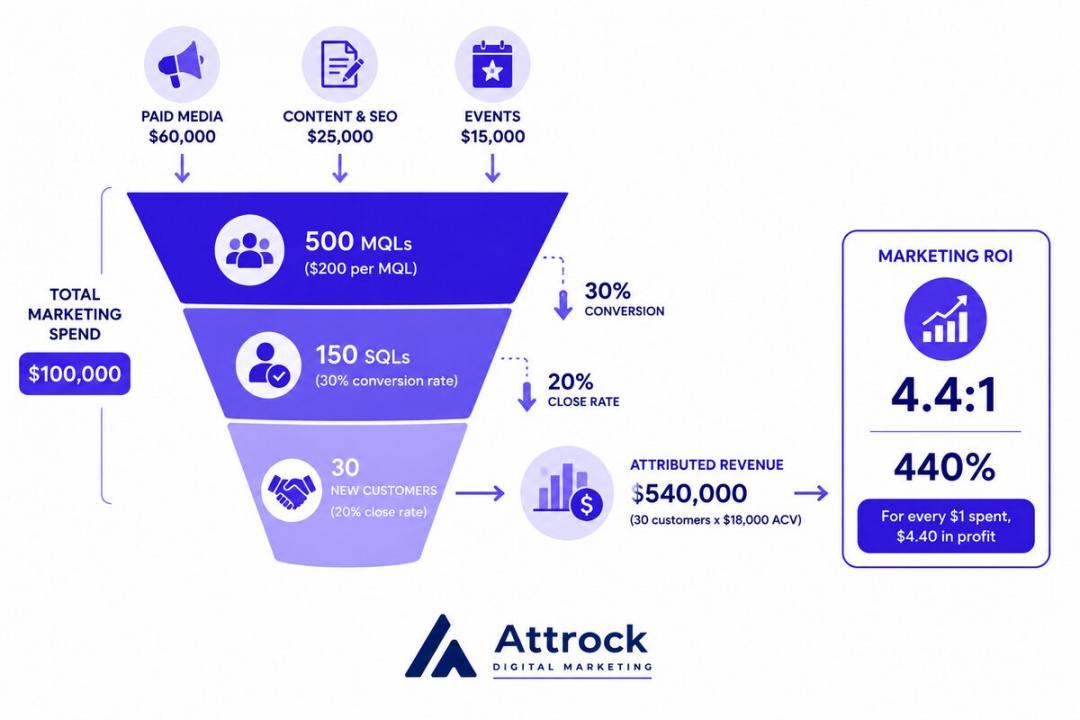
Let's look at a quarterly example for a $5M annual recurring revenue B2B SaaS company with a total marketing budget of $100,000.
- Total Marketing Spend
- Paid Media: $60,000
- Content and SEO: $25,000
- Events: $15,000
- Total Spend: $100,000 (approximately 8% of annual revenue, which aligns with the median percentage published in SaaS Capital’s 2026 Spending Benchmarks for Private B2B SaaS Companies)
- Funnel Conversion
- 500 marketing-qualified leads (MQL) generated ($200 per MQL)
- 150 sales-qualified leads (SQL) qualified (30% conversion rate)
- 30 new customers closed (20% close rate)
- Attributed Revenue
- Average Contract Value (ACV): $18,000
- Total Revenue: $30 customers x $18,000 = $540,000
- The ROI Calculation
($540,000 – $100,000) / $100,000 = 4.4
- As a Ratio: 4.4:1
- As a Percentage: 440%
The Bottom Line: For every $1 spent, marketing generated $4.40 in profit.
Here’s a visual representation of this marketing ROI calculation sample:
Which Marketing ROI Formula Should You Use?
Several marketing ROI formulas exist because revenue isn’t profit, and not all growth comes from campaigns. Pick the formula that matches your margin structure and the decision you need to make.
The table below shows a comparison of ROI formula variants and when to use each.
| Variant | Formula | Use It When | Watch out for |
|---|---|---|---|
| Basic ROI | (Revenue – Cost) / Cost | Margins are thin or broadly similar | Overstates performance for low-margin products |
| Gross-Profit ROI | (Gross Profit – Cost) / Cost | Delivery or product costs are high | Needs clean COGS data per product |
| Incremental/Campaign-Attributable ROI | (Sales Growth – Baseline Growth – Cost) / Cost | You need to separate paid campaign increase from natural organic growth | Baseline must be genuinely comparable |
| CLV-Based ROI | (Lifetime Gross Profit – Cost) / Cost | Retention drives most of the value | Lifetime estimates age quickly |
| MER (Blended ROI) | Total Revenue / Total Marketing Spend | Tracking individual channels becomes unreliable due to privacy tracking limits | Says nothing about which channel worked |
To calculate marketing ROI, subtract total cost from the revenue attributed to marketing. Then, divide by that cost. Multiply by 100 to get the percentage.
What Is a Good Marketing ROI?
There’s no credible cross-industry average for marketing ROI. I went looking for one, including in my own research for this piece, and found nothing primary underneath it.
The Problem with the 5:1 Rule
The 5:1 marketing ROI rule suggests that 5:1 is good, 10:1 is outstanding, and anything below 2:1 falls short. It sounds like a useful benchmark, but it's not often as reliable.
I traced the claim back through multiple sources. Every reference eventually led to one agency blog quoting another. I couldn't find solid research or an original source to support these numbers.
There’s no study behind it. No methodology, no primary source. This benchmark spread because it’s memorable and fills a real gap.
Nobody publishes the actual number, so people reach for the one that circulates.
What the Spending Data Actually Supports
Sourced data can tell you how much companies spend. It can’t tell you what they earn.
| Benchmark | Figure | Source | Published |
|---|---|---|---|
| Marketing budget as a share of company revenue | 7.8%, which is 18% below the mean four years ago | Gartner, 2026 CMO Spend Survey | 2026-06-25 |
| Marketing budget as a share of revenue or overall budget | 9% and 9.6%, respectively | Duke Fuqua, The CMO Survey (35th Edition) | 2026-03-31 |
| Median share of ARR on marketing for private B2B SaaS companies | 8% | SaaS Capital, 2026 Spending Benchmarks | 2026-06-10 |
| Median share of ARR on selling costs | 15% | SaaS Capital, 2026 Spending Benchmarks | 2026-06-10 |
| Paid media as a share of marketing budget | 31.4% | Gartner, 2026 CMO Spend Survey | 2026-06-25 |
From the table above, research from Gartner and Duke Fuqua measures budgets, not marketing ROI.
SaaS Capital’s data shows that equity-backed B2B SaaS companies spend 100% more on marketing than bootstrapped peers. They grow at a median of 25% a year compared to 20%.
However, twice the spend doesn’t result in twice the growth. What counts as good marketing ROI depends on your funding model and stage, not a universal ratio.
How to Read Your Own Number
With no marketing ROI benchmark to compare against, the question is what your own number says about your situation.
The table below shows various symptoms, along with the corresponding item you should check first.
| What You’re Seeing | Most Likely Cause | What to Check First |
|---|---|---|
| Return far higher than expected | Underinvestment, or costs missing from the denominator | Whether salaries, retainers, and subscriptions are included in the cost base |
| Return near zero or negative | Measurement window shorter than the sales cycle | When the revenue actually closed against when you measured |
| Monthly return keeps fluctuating | Channel changes caused the tracking tool to reassign sales | Whether the model changed, or only the channel mix did |
| Strong return but low cash | Long payback period behind a healthy ratio | The number of months to recover acquisition cost, not just ROI percentage |
| Return dropping as you scale | Saturation, cheapest conversions already bought | Marginal return on last spend |
In my view, a very high return usually signals underinvestment. The cheapest conversions get bought first, so returns fall as you scale spend. That’s my reading, not a sourced finding.
There’s no verified cross-industry marketing ROI benchmark. A good number beats your own prior periods at your current spend level and stage.
How to Attribute Revenue to Marketing
Attributed revenue is the closed revenue a business credits to marketing using a defined attribution model. That model choice directly impacts marketing ROI.
In most businesses, this information comes from the CRM rather than an analytics platform. Each closed deal is tied to a marketing campaign based on a set of attribution rules.
That's why two teams can look at the same quarter and report different marketing ROI results. Neither team is necessarily wrong. They simply used different rules to decide which marketing activities should receive credit.
The Five Attribution Approaches
Let’s break it down into the five approaches to attribution. They trade precision against effort in predictable ways.
Each answers a different question and carries a known blind spot.
| Attribution Approach | What It Does | Best For | Main Weakness |
|---|---|---|---|
| First Touch | Credits the first recorded interaction | Understanding what creates initial awareness and demand | Ignores follow-up interactions that closed the deal |
| Last Touch | Credits the final interaction before close | Simple reporting, short sales cycles | Rewards whatever sits closest to conversion |
| Multi Touch | Distributes credit across recorded touches | High volume, short cycles, clean tracking | Needs dense data; degrades as signal is lost |
| Media Mix Modeling | Models aggregate spend against outcomes | Long cycles, offline and retail media | Requires historical data and specialized statistical capability |
| Incrementality Testing | Measures causal increase against a holdout | Validating what other attribution approaches estimate | Requires deliberate test design and patience |
Survey data from EMARKETER and TransUnion in 2025 found that media mix modeling, at 27.6%, was considered the most reliable attribution approach. Another 46.9% of US marketers say they’ll invest more in it.
That shift makes sense to me. MMM survives signal loss because it works on aggregate spend, not user-level tracking.
Which Approach Fits Your Sales Cycle
The right attribution method comes down to how you sell. If your business generates a lot of leads and closes deals quickly, multi-touch attribution is often the better choice. With more customer touchpoints to track, it's easier to see how each marketing effort contributed to the final sale.
If your sales cycle is longer with fewer deals closed, multi-touch attribution becomes less reliable. In these cases, media mix modeling (MMM) or incrementality testing often gives a clearer view.
There’s one common exception. Even if you have a short sales cycle, MMM is still a better choice if you spend heavily on offline or retail advertising. Those marketing touchpoints don't show up in click-based tracking, so multi-touch attribution misses part of the story.
Start by auditing your lead generation strategies, then pick the model your data can support. A model your team can’t maintain is worse than a simpler one that it can.
Assign credit for closed deals to marketing touchpoints using a chosen attribution model. The five most common approaches are first-touch, last-touch, multi-touch, media mix modeling, and incrementality testing.
Why Your Marketing ROI Number Is Probably Wrong
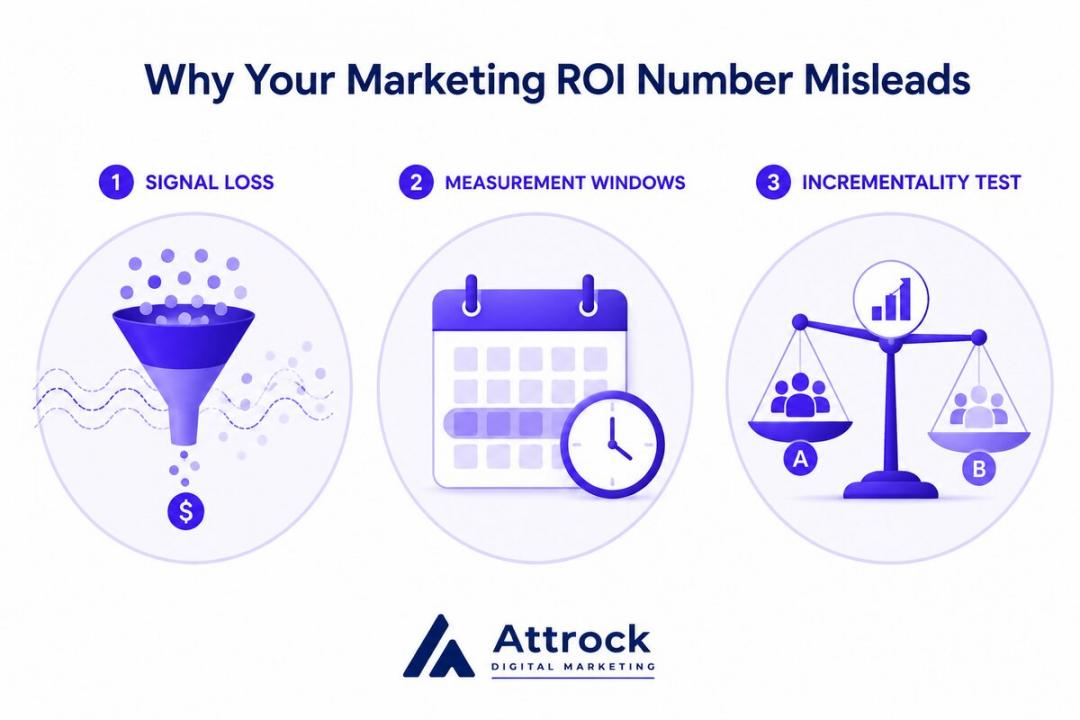
Three things distort most reported marketing ROI figures. Signal loss shrinks what you can see, measurement windows close too early, and almost nobody runs an incrementality test. Knowing how to measure marketing ROI accurately means controlling all three.
On the B2B accounts I’ve run these past two years, my own reporting sits under the same constraints. I show the error bars rather than hide them.
The three compound each other, which is why the combined error gets large.
Signal Loss and Consent Decay
Analytics tools don't capture every customer action anymore because more people choose not to accept tracking cookies. As a result, parts of the customer journey never make it into your reports. This leaves gaps in your data.
Many people assume third-party cookies are the main reason for this. That's understandable, but it doesn't tell the whole story. Google has confirmed that Chrome will continue giving users control over their cookie preferences instead of removing third-party cookies altogether.
The biggest cause of marketing ROI misleads is consent decay. Over time, more visitors are choosing to decline cookie tracking. The more people opt out, the less data your analytics tools collect. This makes it harder to measure marketing ROI accurately.
The Measurement Window Problem
Marketing pays back slower than most teams can measure it.
The CMO survey mentioned above found that the median duration of marketing’s impact on customers has increased to six months. However, more than 70% of marketers still prioritize immediate results.
That gap is the clearest explanation for understated returns. A short window on a six-month effect always reads low.
When calculating marketing ROI, set the measurement window to at least one full sales cycle. Then, read by customer group rather than calendar month.
Failure to Conduct Incrementality Testing
Incrementality testing answers the question every other method dodges. What would have happened anyway?
A geo holdout pauses spend in matched regions and compares them against regions still running. The revenue difference is your incremental increase.
A PSA or ghost-ad test serves a placebo ad to the control group. Exposure stays equal, so only the message differs.
According to the aforementioned EMARKETER and TransUnion survey, 52% of US brand and agency marketers already run these tests.
A geo holdout in outline: matched regions, one paused.
Consent decay shrinks tracking signal and reporting windows close too early. Marketing’s median impact runs six months. Without a holdout, you can’t separate its effect from baseline demand.
The Metrics Behind Marketing ROI
Four metrics are involved in the marketing ROI calculation. Attributed revenue and gross profit set the numerator, while CAC and LTV tell you whether the result holds up.
- Attributed Revenue: This is the top-line dollars a campaign can credibly claim. It’s also the number most often overstated.
- Gross Profit: This is revenue subtracted by cost of goods sold. Use it whenever delivery costs are real.
- Customer Acquisition Cost or CAC: Results from total sales subtracted by marketing spend, then divided by new customers won. Include salaries and subscription fees, not just content.
- Customer Lifetime Value or CLV: This is the gross profit a customer delivers before churning. It rewards retention, so strong customer retention strategies increase marketing ROI without a dollar more in spend.
Comparing Return and Efficiency Metrics
Different metrics evaluate your marketing from specific angles. Use this cheat sheet to understand what each answers, how to calculate it, and where it can mislead:
| Metric | What It Answers | Formula | When It Misleads |
|---|---|---|---|
| Marketing ROI | Did this spend return more than it cost? | (Revenue or Profit – Cost) / Cost | Total costs (salaries, overhead) are left out of the equation |
| ROAS (Return on Ad Spend) | How much revenue did ad spend return? | Ad Revenue / Ad Spend | Ignores product delivery costs and non-ad expenses |
| CAC | What does one new customer cost? | Total Sales and Marketing Spend / New Customers Acquired | Salaries and subscription and platform fees are excluded |
| LTV:CAC | Do your individual customer economics work long-term? | Lifetime Gross Profit / CAC | Lifetime estimates are overly optimistic |
| MER (Media Efficiency Ratio/Blended) | What did total spend return across all channels combined? | Total Revenue / Total Marketing Spend | Organic demand inflates total revenue |
Treat MER as your high-level sanity check against channel-specific attribution models. If your attributed ROI looks great but your blended MER is dropping, your attribution model is likely over-crediting certain channels.
Use LTV: CAC to confirm that your underlying unit economics are healthy before scaling total ad spend.
No. ROAS compares revenue to ad spend. Marketing ROI compares profit to your total marketing cost.
Why Marketing ROI Matters More in 2026?
Tight budgets turn ROI in marketing into a decision tool rather than a report. It settles what gets funded, where the money goes, and whether finance believes any of it. Here are some of the most important reasons why you should pay attention to marketing ROI in 2026:
- Justifying Spend: HubSpot’s 2026 State of Marketing identifies measuring marketing ROI as the top challenge faced by marketers, cited by 33%. Keeping up with trends (29.8%) and generating leads (29.6%) rank below it.
This shows that marketers are now primarily held accountable for proving the financial impact of every dollar spent.
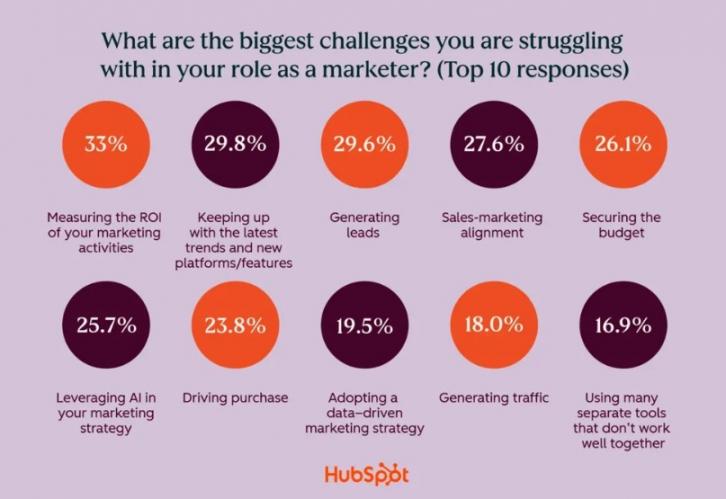
Image via HubSpot
- Allocating Budget: Marketing ROI gives you a consistent way to compare results across paid ads, organic search, and email. Without it, budget decisions often come down to opinions instead of performance.
- Setting Performance Baselines: Gartner found that 73% of CMOs say growth expectations are high, very high, or overly ambitious. A clear performance baseline helps you establish a realistic benchmark.
- Proving Value to Finance: HubSpot also reports 73% of marketers facing more budget scrutiny than before. Vague attribution reads as evasion.
It’s worth noting that the previous Marketing ROI Blueprint by Nielsen finds that 85% of marketers are confident in their ability to measure marketing ROI. However, only 32% actually measure ROI across digital and traditional channels.
One thing changes once reporting becomes trustworthy. Budget conversations stop being interrogations.
Marketing ROI decides which programs get funded and how budget is split across channels. It also determines whether finance can trust marketing’s reports.
How to Improve Marketing ROI
Improving your marketing ROI isn’t about spending more money or working longer hours. It often comes down to measuring performance accurately, testing true channel impact, and aligning your metrics with business goals.
Here are the four key steps:
- Fix the Denominator First: Most disappointing marketing ROI figures trace back to cost scope rather than poor strategy. Before measuring performance, get your team to agree on which team salaries, software, and external agency fees actually belong in your total spend.
- Shift Budget on Evidence, Not Last-Click Credit: Attribution shortcuts naturally pull money toward whatever is easiest to track, like search ads or social clicks. Using holdout tests, where you pause ads for a random sample of users, shows which channels actually drive new revenue instead of claiming credit for customers who would have bought anyway.
- Define Your Measurement Window Before Launch: Always base this timeline on the real length of your customer sales cycle. Deciding on a timeframe after running a campaign allows recency bias or convenient results to dictate your definition of success.
- Report Progress in the Language Finance Uses: Translate metrics like sales pipeline and payback periods into financial terms your CFO already models. For example, client-ready reports should lead directly with revenue contribution rather than vanity metrics like website clicks or impressions.
Best Tools for Tracking Marketing ROI
A good marketing ROI tracking setup connects spend to revenue without manual stitching. Here are three leading platforms that handle attribution across different business needs:
- HubSpot: This tool offers native multi-touch revenue attribution inside Marketing Hub Professional and Enterprise. Its reporting engine features nine attribution models to reveal how default settings skew your channel performance.
While Professional covers lead creation, tracking deals and closed revenue requires Enterprise.

Image via HubSpot
- Ruler Analytics: It specializes in closed-loop B2B marketing attribution by connecting web traffic directly to your CRM. It tracks visitor activity, forms, phone calls, and live chats across long buying journeys.
When pipeline converts into revenue, Ruler pushes real opportunity values back into Google Analytics and ad managers.
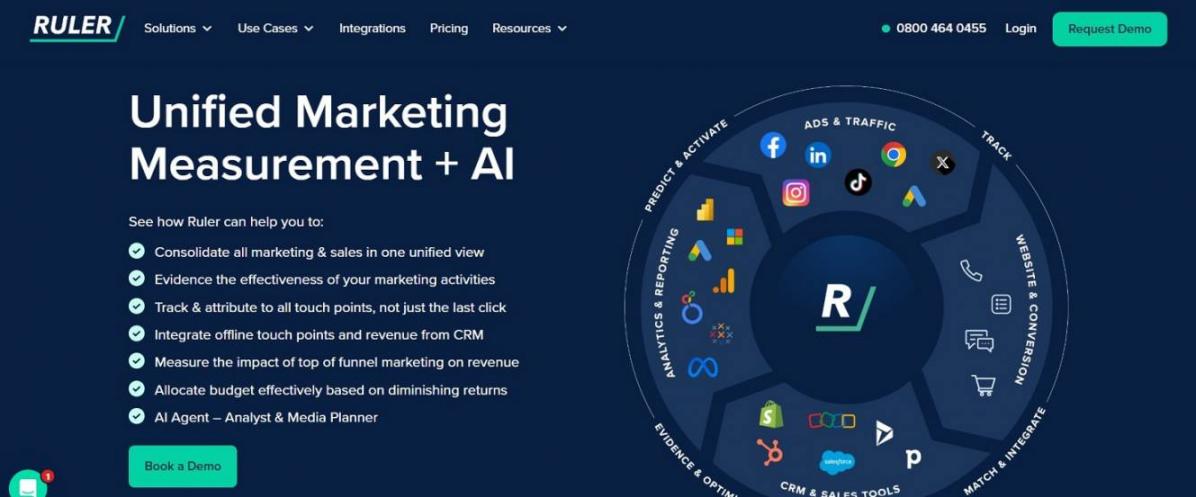
Image via Ruler Analytics
- Triple Whale: Serves e-commerce and direct-to-consumer brands that need first-party tracking across ad platforms. Its central dashboard aggregates ad spend, inventory, and Shopify sales data to give real-time net profit figures.

Image via Triple Whale
Fix cost scope first, then shift budget based on incrementality evidence. Set the measurement window before launch. Finally, report results in terms finance can understand.
FAQ
Q1. What is a good ROI in marketing?
A. There’s no universal good number, and no credible cross-industry average exists. What determines it is your funding model, stage, and margin. A venture-funded company judges the same ratio differently than a bootstrapped one.
Q2. What does a 20% ROI mean?
A. It means you earned $0.20 in profit for every $1 spent. Whether that’s healthy depends on your margin and measurement window. A thin-margin business may find it fine, while a short window may understate it.
Q3. Is a 40% ROI good?
A. It means $0.40 of profit per $1 spent. On its own, the number settles nothing. What resolves it: what it cost to get there and over what window.
Q4. Is ROI basically profit?
A. No. Profit is an amount in dollars. ROI is a ratio of profit to cost. Two campaigns can return identical profit while one costs far more to run.
Q5. What is a good ROI formula?
A. The core formula is revenue attributable to marketing minus cost, divided by cost. Use the gross-profit variant when margins are thin or vary by product. It swaps revenue for gross profit.
Q6. What are the five types of ROI?
A. While corporate finance relies on standard accounting metrics, marketers use distinct frameworks to evaluate performance. The variants actually in use are basic, gross-profit, campaign-attributable, CLV-based, and blended.
Q7. What is the 70/20/10 rule in marketing?
A. It’s a budget allocation rule of thumb: roughly 70% proven channels, 20% emerging, and 10% experimental. It guides where budget goes. It doesn’t measure what comes back.
Q8. What are common marketing ROI mistakes?
A. There are three main reasons why. Incomplete cost scope leaves out salaries and tools. Last-click attribution hands all credit to the final touch. A short window buries revenue that hasn’t landed.
Q9. How long does it take to see marketing ROI?
A. It usually takes months. Marketing’s impact on customers runs a median of about six months, so short windows mislead. Set your measurement window to at least the length of your sales cycle.
Fix the Inputs Before You Judge the Number
Marketing ROI shows how much profit your marketing brings in compared to what you spend. The formula is easy to understand. The hard part is making sure you're using the right data.
What makes the result reliable is including every relevant cost and measuring performance over a long enough period. Those two things matter more than comparing your numbers to industry benchmarks.
Before you launch your next campaign, decide which costs to include. Choose a reporting window that matches your typical sales cycle.
Get those basics right, and you'll have a marketing ROI figure you can explain and trust.
Ready to turn your traffic into measurable revenue? Partner with our team for expert conversion rate optimization services. Start maximizing the true return on your marketing spend today. You can also use HubSpot Marketing Hub to track campaign performance and marketing ROI more effectively.
Disclaimer: This content contains some affiliate links for which we will earn a commission (at no additional cost to you). This is to ensure that we can keep creating free content for you.