- The real job is proving ROI, not collecting data. Most teams have more dashboards than answers. The right tool ties spend to revenue across fragmented channels.
- Marketing analytics tools fall into four groups: web and product analytics, business intelligence and visualization, data connectors, and all-in-one platforms with a built-in CRM.
- Free options are genuinely good. Google Analytics 4, Looker Studio, and Matomo can cover a lot before you pay anything.
- Most teams run a stack of three to six tools, not one winner. You combine a tracker, a reporting layer, and often a connector.
- Match the tool to the channel mix you must prove ROI on, not to the longest feature list. That single rule prevents most overspending.
Marketing analytics tools collect, unify, and measure your marketing data across every channel so you can see what actually drives revenue. Based on my extensive experience operating such systems within my agency, my top picks for 2026 are HubSpot Marketing Hub, Google Analytics 4, Looker Studio, Mixpanel Amplitude, Matomo, Supermetrics, Whatagraph, and Tableau.
Each tool covers different areas, ranging from free website monitoring to multi-channel attribution and executive dashboards.
Finding marketing analytics tools is not the hard part. The hard part is choosing the perfect blend for your team while keeping costs in check and not getting overwhelmed by too many dashboards.
So I made a thorough study, checked the prices, and created this guide to introduce you to the strengths of each platform, how the nine marketing analytics tools compare, and how to pick the ones you need.
Disclaimer: This content contains some affiliate links for which we will earn a commission (at no additional cost to you). This is to ensure that we can keep creating free content for you.
What Do Marketing Analytics Tools Do and What ROI Problem Do They Solve?
A marketing analytics tool is software that collects marketing data from your channels, consolidates it, and turns it into actionable reports. The best marketing analytics tools measure marketing performance in one place. They answer one question above all others: which marketing campaigns and channels actually drive revenue.
That question has never been harder to answer.
According to the Gartner 2025 CMO Spend Survey, marketing budgets sat flat at 7.7% of company revenue in 2025, and 59% of CMOs said they lacked the budget to deliver their strategy. Martech now eats roughly 22% of the marketing budget, yet much of it goes underused. So the pressure to prove returns keeps rising while resources remain the same.
Data fragmentation is the biggest issue. Your data is spread across various ad networks, your email tool, your social media schedulers, your CRM, and your website. Each of these reveals a fragment of the whole picture without telling the whole story. Marketing analytics platforms unite these pieces and provide you with a cohesive view ready to aid your decision-making.
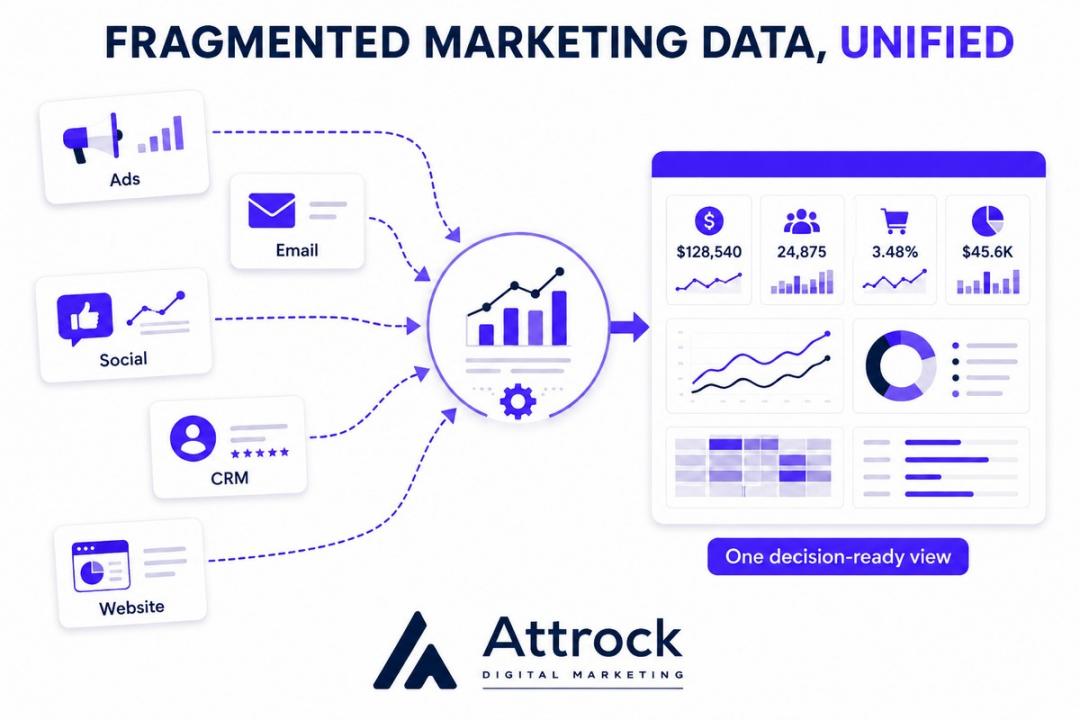
Image via Attrock
There are three major benefits to unifying data. First, you can track revenue directly back to the channels that generated it. Second, you can eliminate non-converting expenses. Finally, rather than guessing, you can plan the next step based on solid insights.
The goal is not more reporting. It is proving ROI across scattered channels under a flat budget. Pick the tools that close your biggest measurement gap first.
What Are the Types of Marketing Analytics Tools?
Marketing analytics tools split into four practical categories, and most marketing stacks blend two or three of them. Knowing the categories saves you from buying overlapping marketing analytics software.
Web and product analytics tools, such as Google Analytics 4, Mixpanel, Amplitude, and Matomo, track visitor behavior on your site or app. Complementing them are business intelligence and visualization tools, such as Tableau and Looker Studio, which turn raw data into dashboards.
Data connectors move data from many sources into one place, which is where Supermetrics fits. All-in-one platforms combine analytics with a CRM, and HubSpot Marketing Hub is the clearest example of a marketing analytics platform.
Underneath the tools sit four types of analytics. They build on each other as your measurement matures.
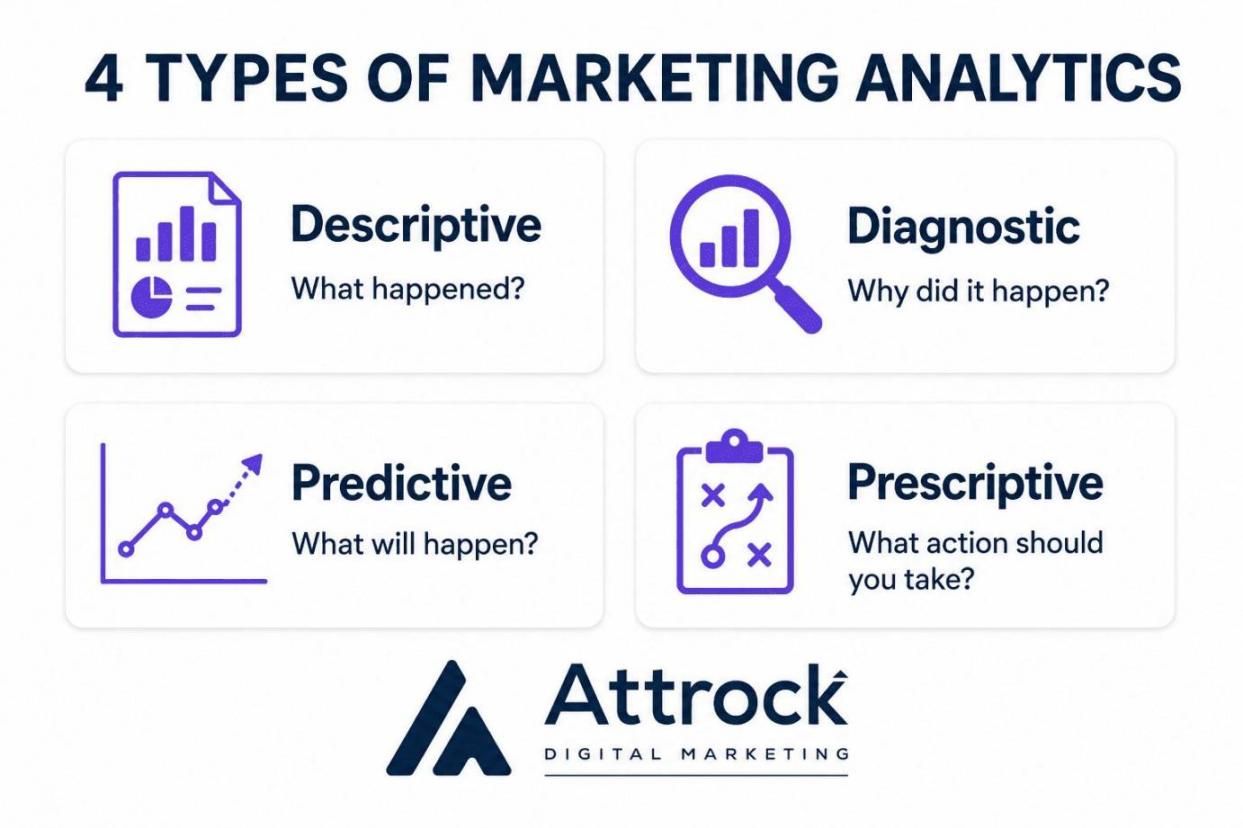
Image via Attrock
| Analytics Type | Question It Answers | Marketing Example |
|---|---|---|
| Descriptive | What happened? | Last month's traffic, conversions, and channel revenue |
| Diagnostic | Why did it happen? | Why a campaign's cost per lead spiked |
| Predictive | What will happen? | Forecasting next quarter's pipeline from current trends |
| Prescriptive | What action should you take? | Recommending budget shifts to the highest-return channels |
Most tools start with descriptive and diagnostic views. The stronger platforms now add AI-powered predictive and prescriptive features, which I cover later.
You do not need every type on day one. Get descriptive and diagnostic right first, then add prediction once your data is clean and trusted.
How I Picked the Best Marketing Analytics Tools
Instead of relying on a feature sheet for each tool, I evaluated them as if I were doing a real client project. I specifically assessed each tool’s usefulness to marketing teams who have to report results.
I examined six criteria:
- Data sources and integrations: How many channels do they natively pull together?
- Reporting and dashboards: How quickly do you get a neat, shareable picture?
- Attribution depth: How accurately do they connect touchpoints to revenue?
- Ease of use and onboarding: How quickly can a team start to use it?
- Pricing and free plan: What do you get both before and after paying?
- Data governance and privacy: How do they deal with consent and ownership?
I checked prices against each vendor's official price page and added a link from every rating back to its source. Where a number could not be confirmed at the time of writing, I noted it.
Even if you get a tool that looks good on paper, it may still not suit your team. What matters is how quickly your team can adopt it, whether the software integrates with everything else you use, and whether the vendor is transparent about its pricing. Otherwise, you might not get a good return on your investment.
Marketing Analytics Tools: Quick Comparison
Here is a quick overview of the best marketing analytics software before the detailed reviews. Pricing is the original monthly list price in USD, and every rating links to its source. Jump to any tool for the full breakdown.
| Tool | Best For | Starting Price | Free Plan | G2 Rating |
|---|---|---|---|---|
| HubSpot Marketing Hub | All-in-one analytics + CRM attribution | Free; paid from $20/seat/mo | Yes | 4.4 |
| Google Analytics 4 | Free web and cross-channel tracking | Free | Yes | 4.5 |
| Looker Studio | Free dashboards on Google data | Free; Pro $9/user/mo | Yes | 4.4 |
| Mixpanel | Product and funnel analytics | Free; custom pricing for paid | Yes | 4.5 |
| Amplitude | Product analytics + attribution | Free; Plus from $0/mo | Yes | 4.5 |
| Matomo | Privacy-first web analytics | Free self-hosted; Cloud from ~$26/mo | Yes | 4.2 |
| Supermetrics | Pulling marketing data into one place | From ~$55/mo | No (trial) | 4.4 |
| Whatagraph | Automated client and agency reports | From $812/mo | No (trial) | 4.5 |
| Tableau | Advanced BI and visualization | From $900/mo | No (trial) | 4.4 |
How to Choose the Best Marketing Analytics Tool for Your Business
Match your marketing analytics tools to your most important variable: the channel mix you must prove ROI on, not the longest feature list. A solo founder and a 50-person marketing team need very different stacks.
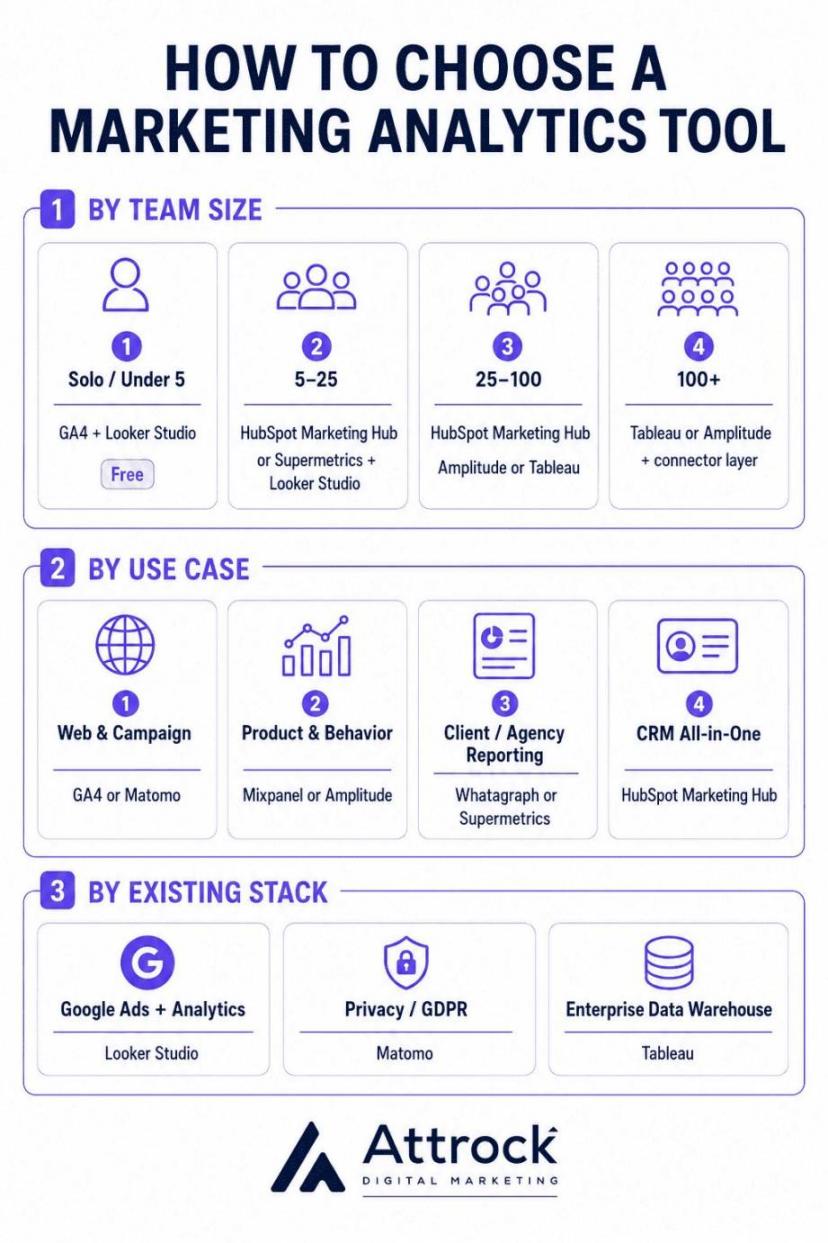
Image via Attrock
Start with what you are trying to measure. If you live in Google Ads and organic search, a free GA4 and Looker Studio pairing covers most of it. If you sell a product or app, product analytics like Mixpanel or Amplitude matter more. If you run an agency, automated client reporting moves to the top.
Choosing a Marketing Analytics Tool
By team size:
- Solo or under 5: Google Analytics 4 plus Looker Studio (free)
- 5 to 25: HubSpot Marketing Hub or Supermetrics plus Looker Studio
- 25 to 100: HubSpot Marketing Hub, Amplitude, or Tableau
- 100-plus: Tableau or Amplitude with a connector layer
By use case:
- Web and campaign tracking: GA4 or Matomo
- Product and behavior: Mixpanel or Amplitude
- Client or agency reporting: Whatagraph or Supermetrics
- All-in-one with CRM: HubSpot Marketing Hub
By existing stack:
- Heavy Google Ads and Analytics: Looker Studio
- Privacy or GDPR priority: Matomo
- Enterprise data warehouse: Tableau
Ask these five questions before you commit to any marketing analytics tool:
- What is the actual cost of this product, not just the price on the sticker?
- Will my team actually adopt it?
- Does it integrate with my current workflow?
- What should I expect in the third year when the data has grown?
- Can I export and leave without pain?
Most teams operate between three to six marketing analytics tools, not one. A tracker, a reporting layer, and a connector are the most important ingredients for a healthy stack. For more on turning these numbers into action, see my guide on how data improves marketing.
The cheapest mistake is buying one platform to do everything. Pick for your biggest gap first, then add tools as your measurement grows.
What Are the 9 Best Marketing Analytics Tools?
Below is the full breakdown of each of the nine marketing analytics tools, in the same order as the comparison table. Every review follows the same structure so you can compare them fairly.
1. HubSpot Marketing Hub
Image via HubSpot
HubSpot Marketing Hub is an all-in-one marketing analytics tool that ties your campaigns, forms, and emails directly to customer records in its built-in CRM. That connection is why it earns the top spot for teams that want marketing data and revenue in one place.
It pairs marketing analytics with built-in marketing automation, so reporting and campaigns can be accessed on a single dashboard. This makes it perfect for marketers who are tired of manually stitching reports together.
It lets you directly link your marketing activities to revenue generation. You can track which campaign brought in a contact and whether that contact turned into a customer on the platform.
Key Features
- Marketing Analytics and Dashboards: Pre-built and custom dashboards for traffic, campaigns, and revenue
- Multi-Touch Revenue Attribution: Ties revenue to the touchpoints that earned it (Enterprise tier)
- Customer Journey Analytics: Maps how contacts move from first touch to customer
- Campaign Reporting: Measures every asset in a campaign in one view
- CRM integration: Marketing data and sales data can be accessed on a single screen
Pros
- You can access Marketing and CRM data on the same dashboard
- Strong attribution and journey reporting
- Large integration library and a deep knowledge base
Cons
- Costs climb quickly as contacts and seats grow
- The strongest attribution features are gated behind the Enterprise plan
- It is more than small teams tracking only their web traffic need
Pricing
- Free
- Starter: $20/month/seat
- Professional: $890/month/seat
- Enterprise: $3,600/month
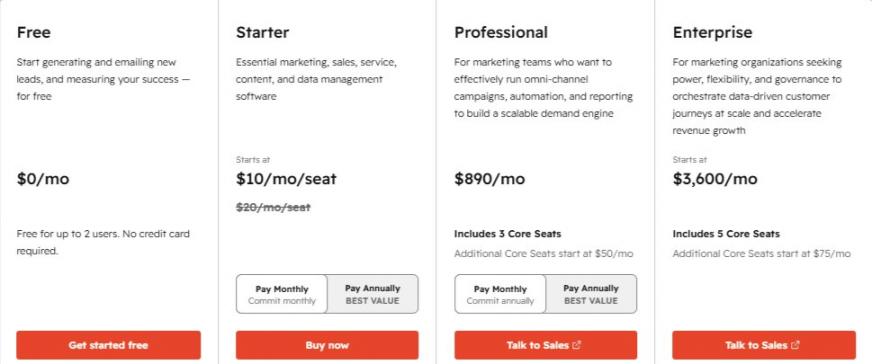
Image via HubSpot
Tool Level
- Ideal for SMBs and enterprise marketing teams needing CRM and analytics in one platform
Usability
- Intuitive, well-documented interface that's easy to learn for basic reporting
Pro Tip: First, connect your ad accounts and CRM, then create a revenue dashboard before adding more. The closed-loop view is the feature that really makes HubSpot worthwhile.
2. Google Analytics 4

Image via Google Analytics 4
Google Analytics 4 (GA4) is one of the most widely used marketing analytics tools. It’s widely used across the industry to track website data such as traffic, user engagement, and conversions. It is often the marketer's default first choice tool, and for good reason.
It provides event-based tracking, conversion paths, and audience information entirely for free, while also offering the deepest level of Google Ads integration.
Key Features
- Captures user engagement across websites and mobile apps
- Reveal the paths users take to convert
- Native, two-way data sharing
- Build and export segments for targeting
- Pipe raw data out for deeper analysis
Pros
- Free, powerful, and widely used
- Tight integration across Google Ads and Search
- Raw data export to BigQuery at no extra cost
Cons
- The event-based model can take time to learn, especially if you’re used to Universal Analytics.
- Reports can feel less intuitive than those in purpose-built dashboard tools
- Data sampling and reporting thresholds may become frustrating when working with large datasets
Pricing
- Free
Tool Level
- Suitable for teams of any size, from individual marketers to large corporations, as the basic web analytics layer.
Usability
- A bit complex and not too intuitive. You will need some handholding, afterwards you can combine it with a dashboard tool for better report visualization.
Pro Tip: Connect your GA4 data to Looker Studio to create neater, more visually engaging dashboards. GA4 is great for exploring the data itself. Looker Studio is a better choice when you want to explain the insights to your stakeholders.
3. Looker Studio
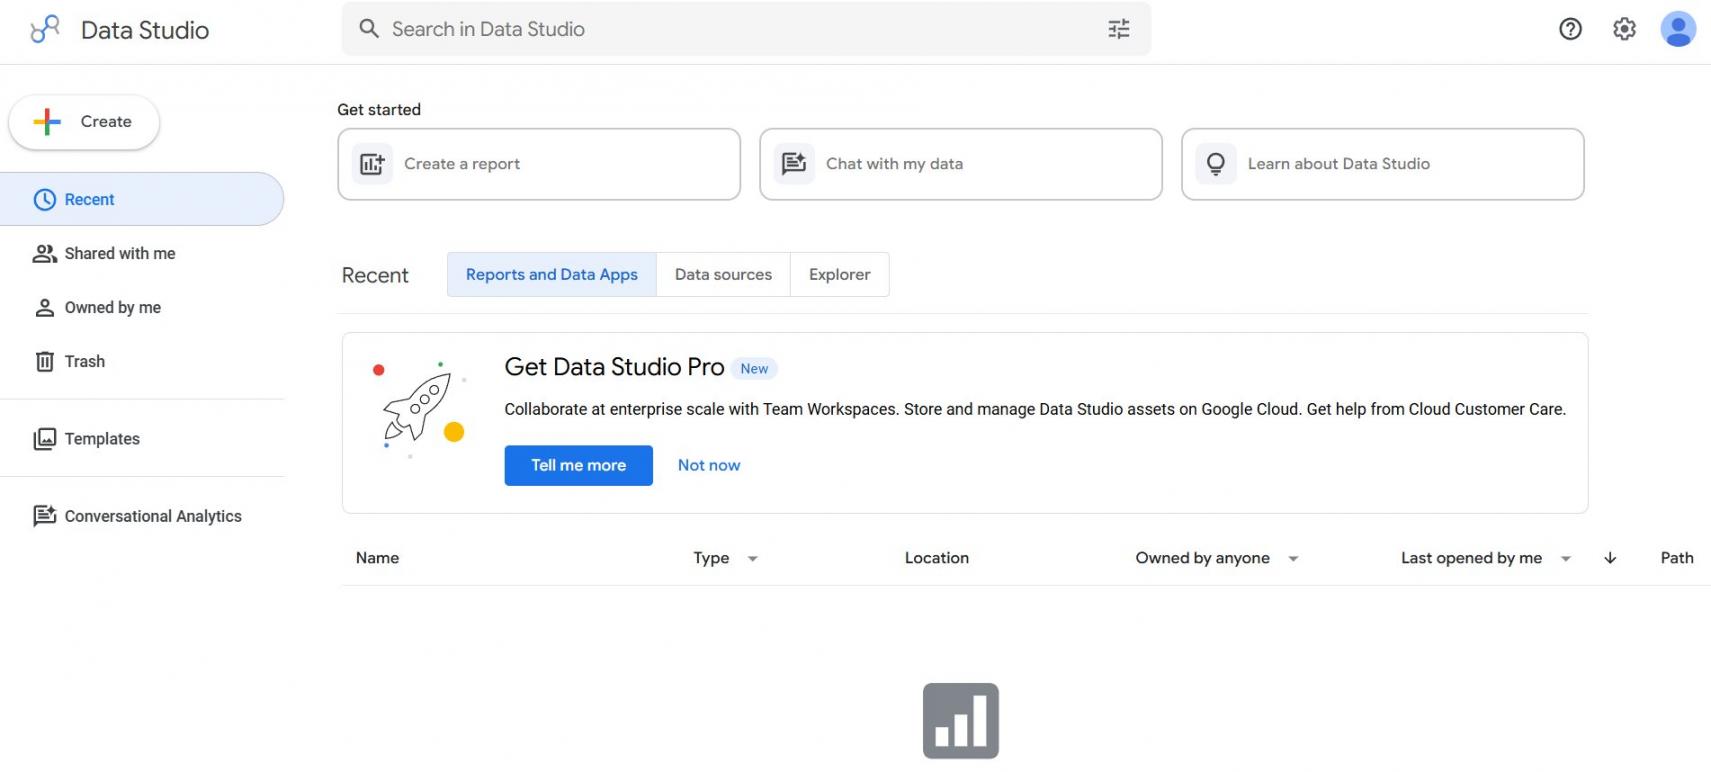
Image via Looker Studio
Looker Studio (now Data Studio) is one of the best free marketing analytics tools. It’s a data visualization and dashboarding tool that turns marketing data into shareable reports. It integrates natively with GA4, Google Ads, and other Google data, which makes it the easiest free way to build marketing dashboards. Looker Studio is best for teams already living in the Google ecosystem.
It builds clean, shareable, auto-updating dashboards from GA4 and Google Ads without a license fee.
Key Features
- Drag-and-Drop Reports: Build dashboards with no code
- Native Google Connectors: GA4, Google Ads, Search Console, Sheets
- Live, Shareable Dashboards: Reports update automatically and are shared by link
- Templates: Start fast with prebuilt marketing layouts
- Blending: Combine multiple sources in one chart
Pros
- Free for core use, which is rare for a dashboard tool
- Native, reliable connections to Google data
- Easy sharing for stakeholders and clients
Cons
- Non-Google sources often require a paid connector
- Large or blended datasets can negatively impact performance
- Fewer advanced visualizations than full BI tools
Pricing
- Free
- Looker Studio Pro: $9/month/user
Tool Level
- Most suitable for individual entrepreneurs as well as mid-sized teams that mainly handle data coming from Google.
Usability
- It is one of the easiest tools to use here. Generally, marketers can create a functioning dashboard within a few hours.
Pro Tip: Start from a template, then connect GA4 and Google Ads first. Add a connector only when you need non-Google sources.
4. Mixpanel
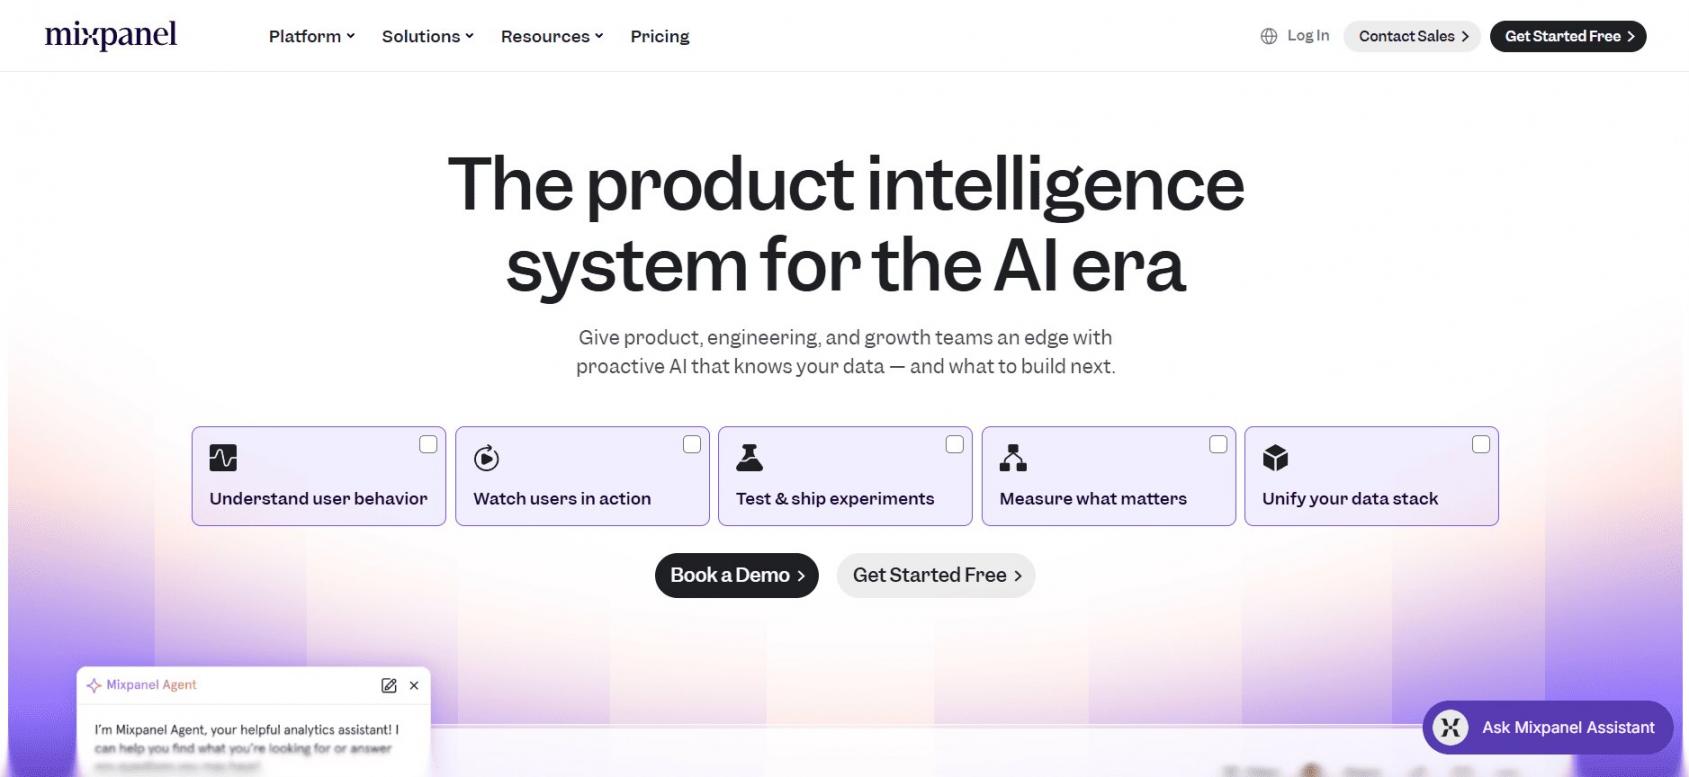
Image via Mixpanel
Mixpanel is one of the most detailed marketing analytics tools. It’s a product analytics tool that connects behavioral events to individual users across their lifecycle. It is the preferred choice for SaaS and app teams that need to understand activation, retention, and funnel drop-off inside the product. Marketers use it to see what happens after the click.
Since it operates at the user level, you will have insight into activation, retention, and funnel drop-off rather than just bare page views.
Key Features
- Event and Funnel Analysis: Track conversion step by step
- Retention and Cohort Reports: See who stays and why
- User-Level Tracking: Follow individuals across sessions
- Reports and Boards: Share insights with the team
- Warehouse Connectors: Sync with your data stack
Pros
- Excellent for funnel, retention, and activation analysis
- Generous free tier for early-stage teams
- Clean, fast interface for self-serve analysis
Cons
- Less suited to traditional web or campaign reporting
- Usage-based pricing can rise sharply with event volume
- Requires a clear event-tracking plan to be useful
Pricing
- Free
- Growth: From $0, custom pricing
- Enterprise: Contact Sales
Tool Level
- Best for startups through mid-market SaaS and app teams focused on product behavior.
Usability
- Friendly once your events are defined. The upfront tracking plan is the real work.
Pro Tip: Map your key events before you implement. Mixpanel is only as good as the tracking plan behind it.
5. Amplitude
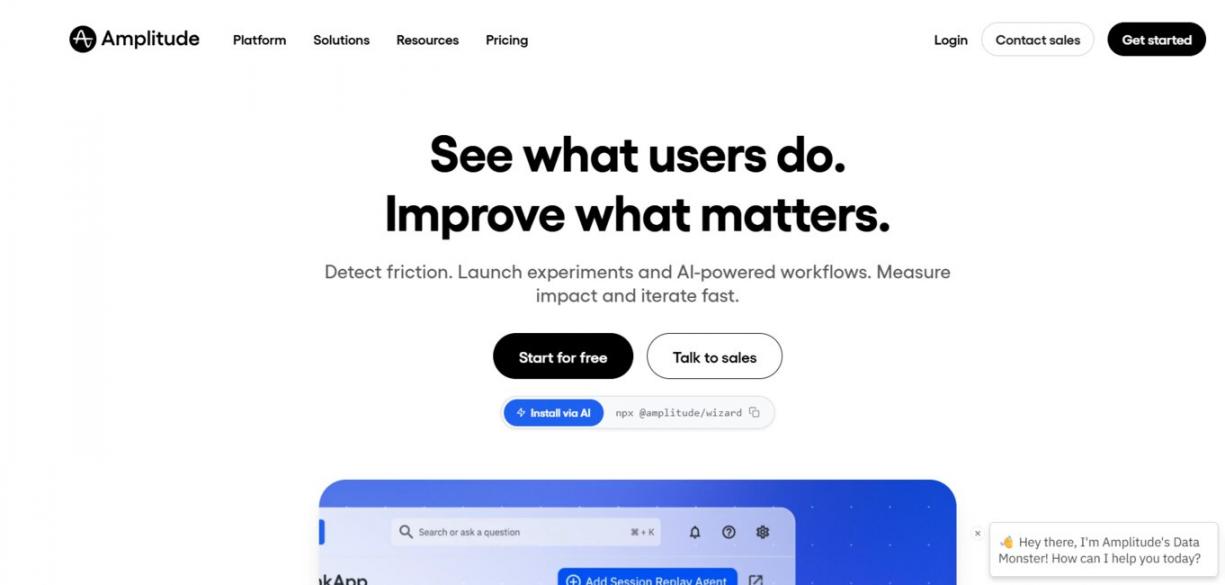
Image via Amplitude
Amplitude is one of the most versatile marketing analytics tools. It’s a digital and product analytics platform that pairs behavioral analysis with built-in experimentation. It competes directly with Mixpanel but leans further into causal insights and revenue attribution. Its 2026 acquisition of InfiniGrow pushed it deeper into marketing analytics.
It combines behavioral analytics, experimentation, and revenue attribution so that product and marketing teams can work from a single dataset.
Key Features
- Deep event and journey analysis
- Built-in A/B testing and feature flags
- Tie marketing touches to revenue
- Forecast and target likely behavior
- Connects to ad, CRM, and warehouse tools
Pros
- Strong behavioral and causal analysis in one place
- Experimentation is native, not bolted on
- Small teams can start for free with the free tier
Cons
- The Growth tier requires a sales conversation
- Depth can overwhelm teams that only need basic reports
- Full value needs solid data instrumentation
Pricing
- Free
- Plus: Starts at $0
- Growth: Custom
- Enterprise: Custom
Tool Level
- This tool is ideal for product and growth teams at mid-market and enterprise organizations.
Usability
- Modern and slightly complex, with a moderate learning curve. It offers onboarding support, which larger teams will find useful.
Pro Tip: You may use the free tier to demonstrate the value of a single funnel first. Later, you can move to experimentation once stakeholders have faith in the data.
You May Also Like:
6. Matomo
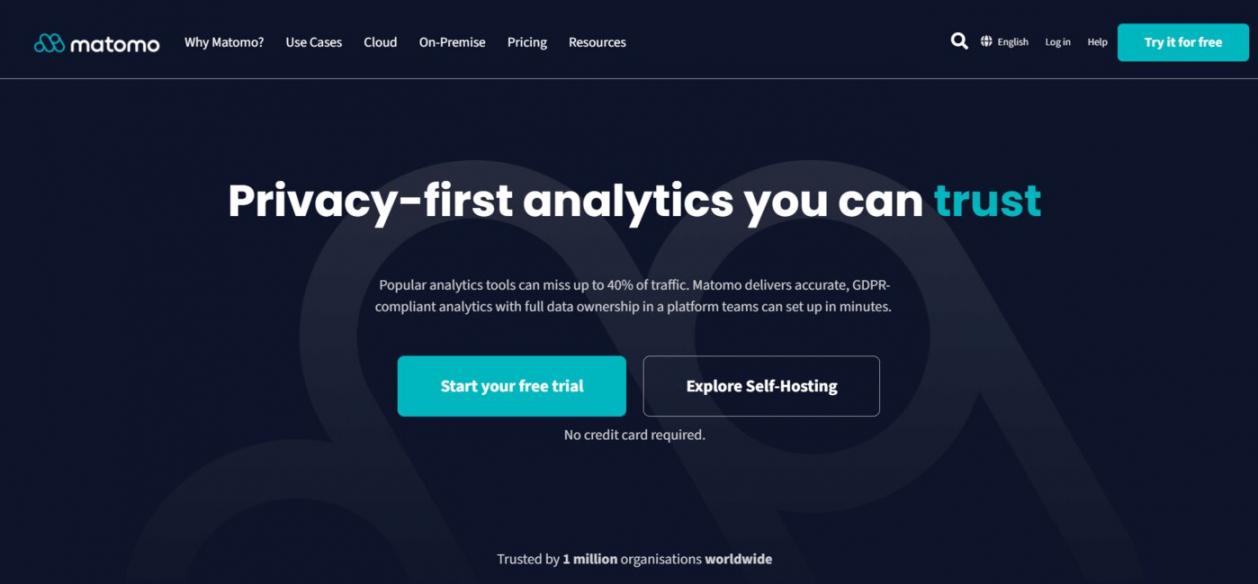
Image via Matomo
Matomo is one of the most powerful marketing analytics tools for teams that prioritize user privacy. Regarded as a worthy alternative to Google Analytics, this web analytics software gives you complete control over your data.
Also offering GDPR-compliant tracking methods, Matomo is the best choice for teams that want to use web analytics without giving their data to a third party.
It offers web analytics that’s on par with Google Analytics while also allowing you to keep complete ownership of your data. Customer tracking can also be achieved without cookies and even without their express consent.
Key Features
- You may self-host or use the EU cloud
- Cookie-free tracking options are available
- You can easily track visits, sources, goals, and funnels
- Behavior beyond pageviews
- Reports use all your data
Pros
- Good privacy and compliance features
- You may use the tool for free if you self-host
- Reporting is similar to Google Analytics
Cons
- Self-hosting requires technical setup and maintenance
- It offers an integration ecosystem that’s smaller than Google’s
- Cloud pricing increases with traffic to your site
Pricing
Matomo offers two distinct pricing tiers: Cloud and On-Premise
Pricing options òn the Cloud tier include:
- Business: $26/month
- Enterprise: Contact Sales
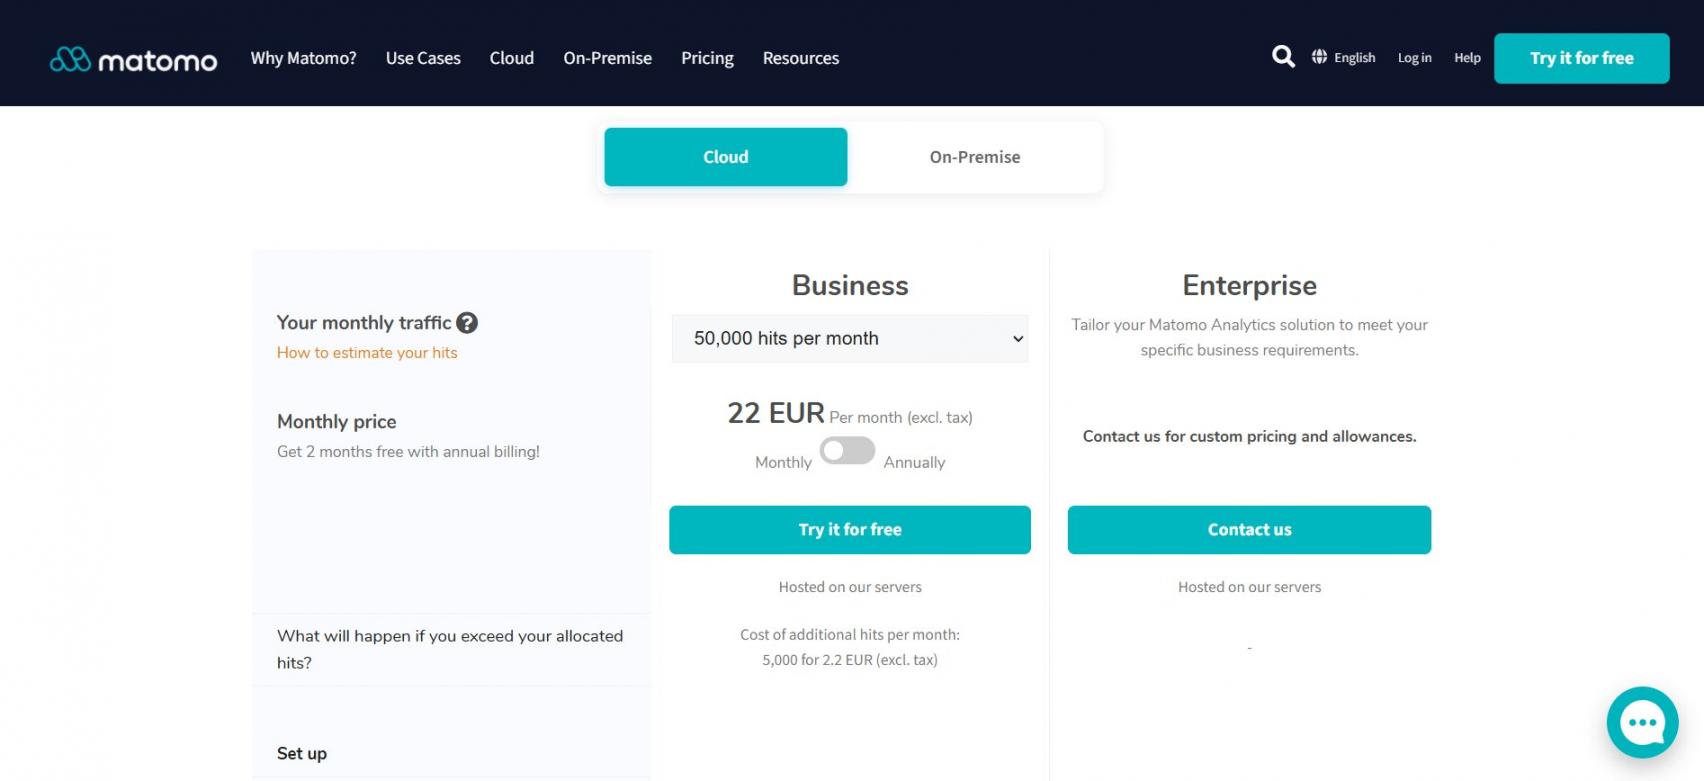
Image via Matomo
On the On-Premise tier:
- Community: Free
- Team: $313/month
- Business: $1652/month
- Enterprise: $3874/month
- VIP: Custom
Tool Level
- Best for privacy-conscious SMBs through enterprises and regulated industries.
Usability
- Very easy to understand if you have already used GA. Voluntary self-hosting may introduce some technical challenges.
Pro Tip: Opt for Cloud if you are short of engineers. There are still privacy benefits either way.
7. Supermetrics
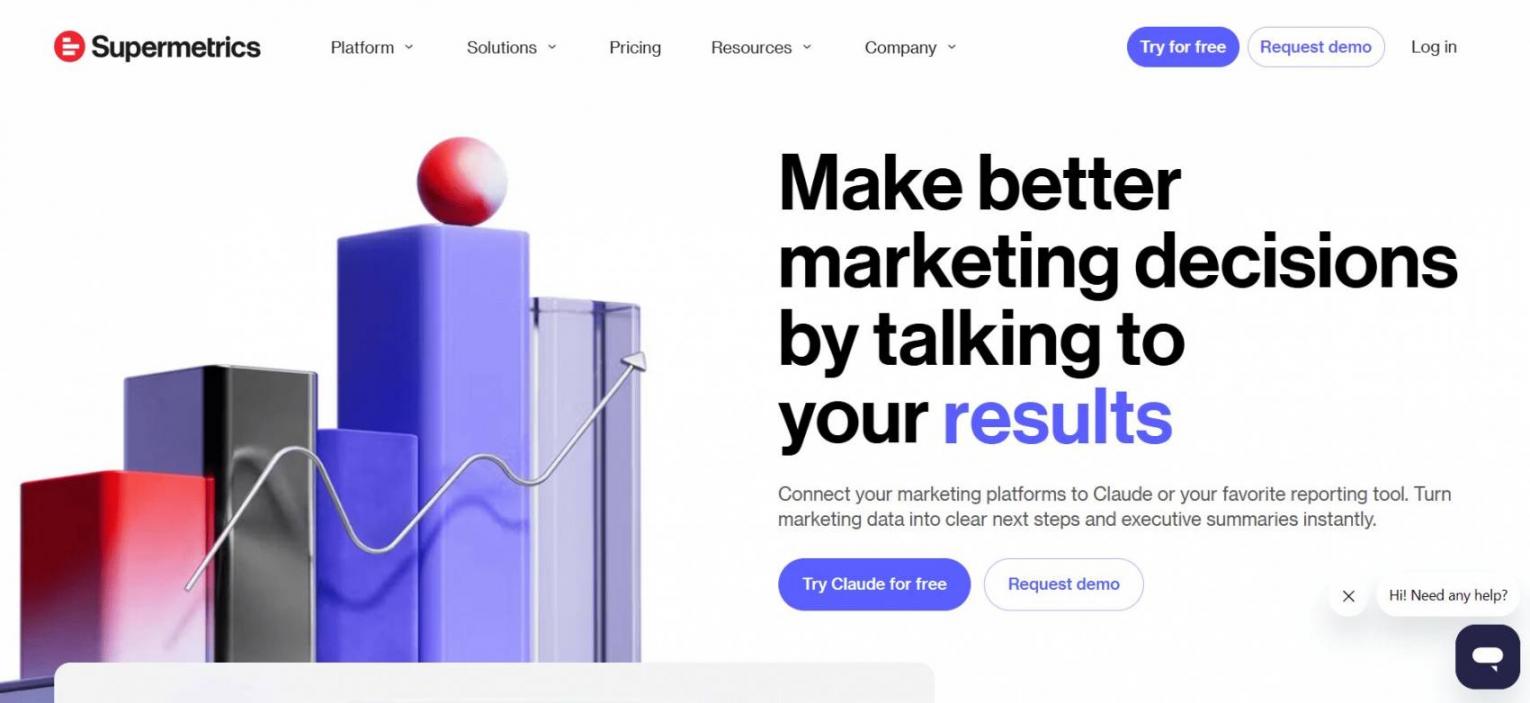
Image via Supermetrics
Supermetrics is one of the most comprehensive marketing analytics tools. It’s a data connector that pulls marketing data from hundreds of platforms into a single place, such as a spreadsheet, dashboard, or data warehouse. It is not a dashboard itself. It is the plumbing that feeds your reports, which is why agencies and data teams rely on it.
It centralizes marketing data from hundreds of sources into the destination you already use, so your dashboards stay up to date automatically.
Key Features
- Connects with ads, social, SEO, CRM, and more
- Exports to Sheets, Looker Studio, Excel, and BigQuery
- Refreshes data automatically on schedule
- Transforms and blends data before export
- Includes ready-to-use reporting templates
Pros
- Saves hours of manual data pulling
- Works with the dashboards you already use
- Wide source coverage for marketing teams
Cons
- It feeds reports but does not visualize on its own
- Pricing scales with sources and data volume
- Some connectors cost more than others
Pricing
- Starter: $55
- Growth: $222
- Enterprise: Contact Sales
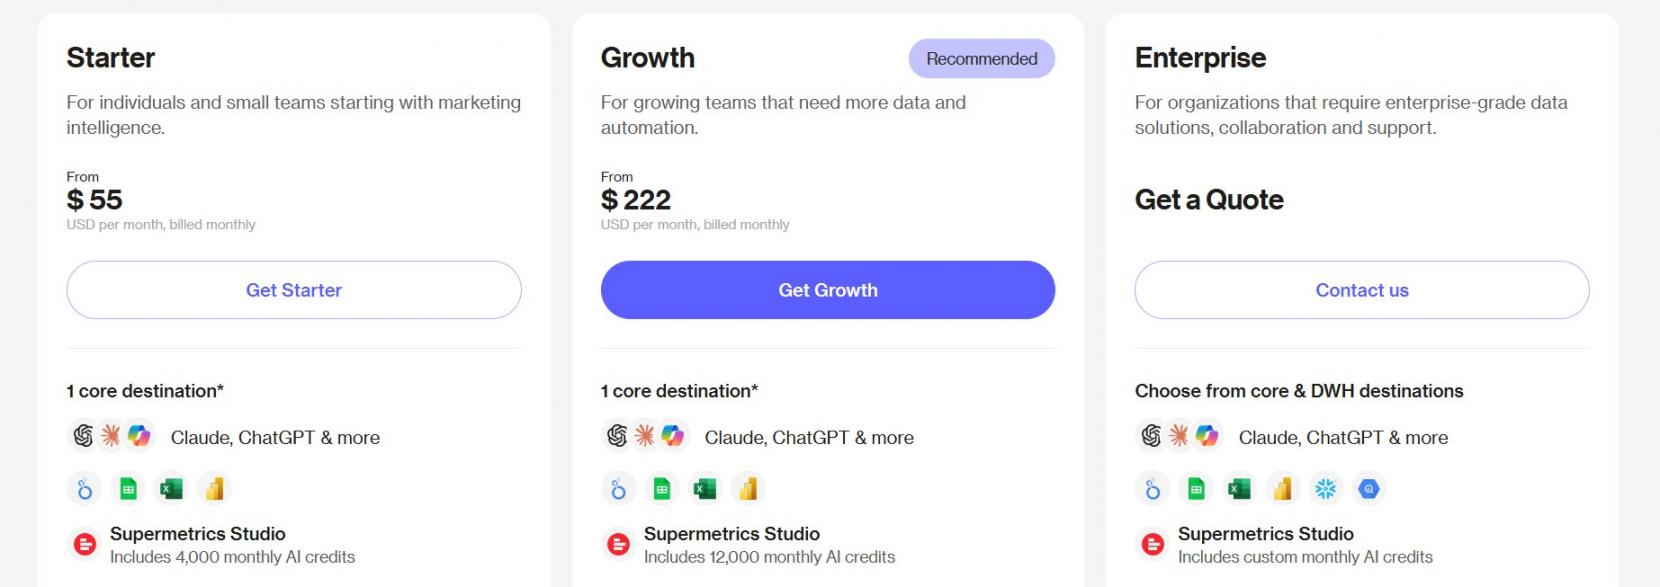
Image via Supermetrics
Tool Level
- Best for agencies, small and mid-sized businesses, and data teams that manage reporting across multiple channels.
Usability
- Connecting a data source is relatively simple for most teams.
Pro Tip: Pair Supermetrics with Looker Studio to build an affordable, automated reporting setup. The combination of a paid connector and a free dashboard tool offers excellent value.
8. Whatagraph
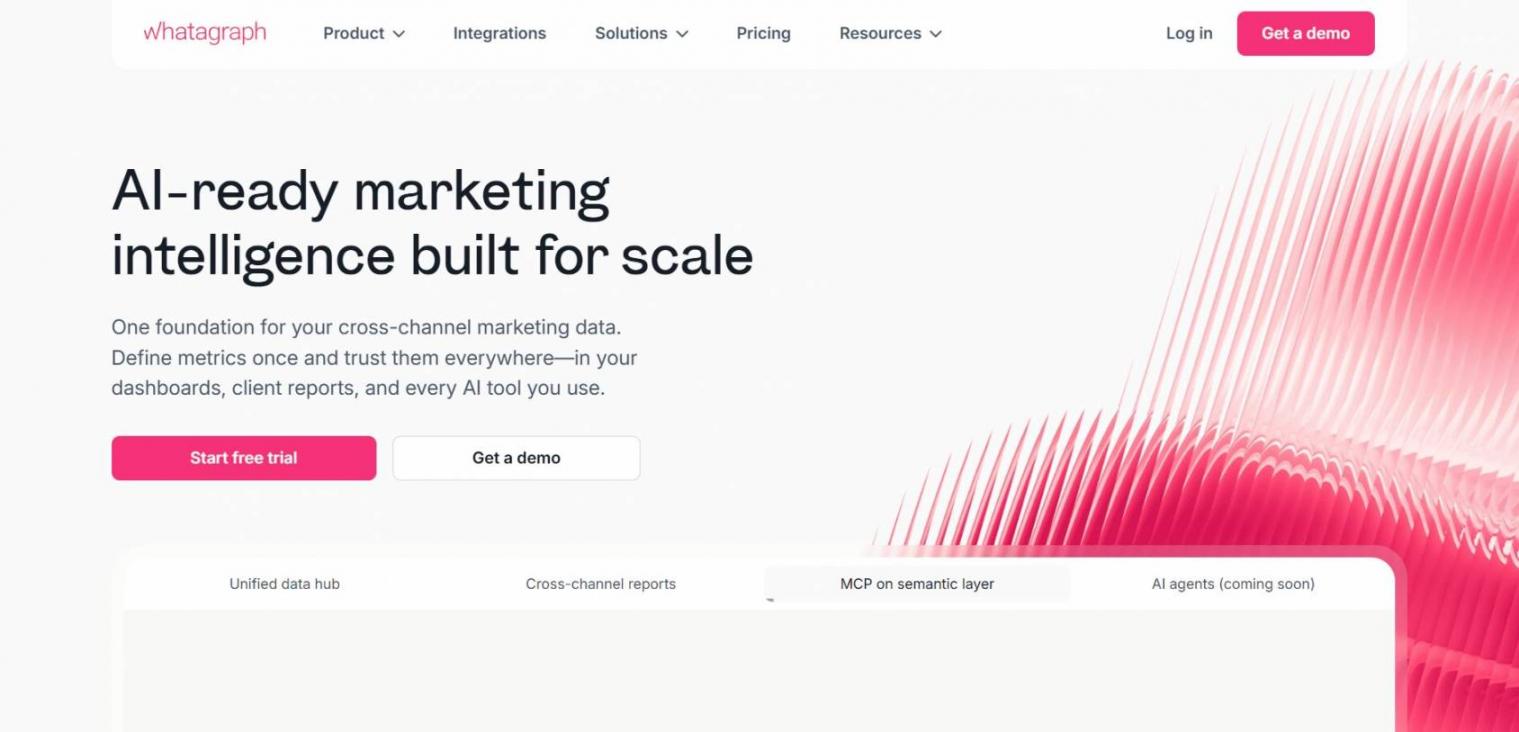
Image via Whatagraph
Whatagraph is one of the most specialized marketing analytics tools. It’s a marketing reporting tool built to automate cross-channel client and agency reports. It integrates with dozens of marketing channels and turns them into branded, shareable reports. It is best for agencies and teams that send regular reports to stakeholders.
It automates branded, cross-channel reports, so client updates can be handled quickly and efficiently.
Key Features
- Combines ads, social, SEO, and web data
- Creates client-ready branded reports
- Schedules reports for automatic delivery
- Includes ready-to-use report templates
- Merges multiple data sources into one view
Pros
- Built specifically for client and agency reporting
- Clean, presentable, branded output
- Strong automation that saves recurring effort
Cons
- Less suited to deep ad-hoc analysis
- Pricing is quote-based, which slows comparison
- Most useful for reporting, not exploration
Pricing
- Max: From $812/month
- Prime: Custom pricing
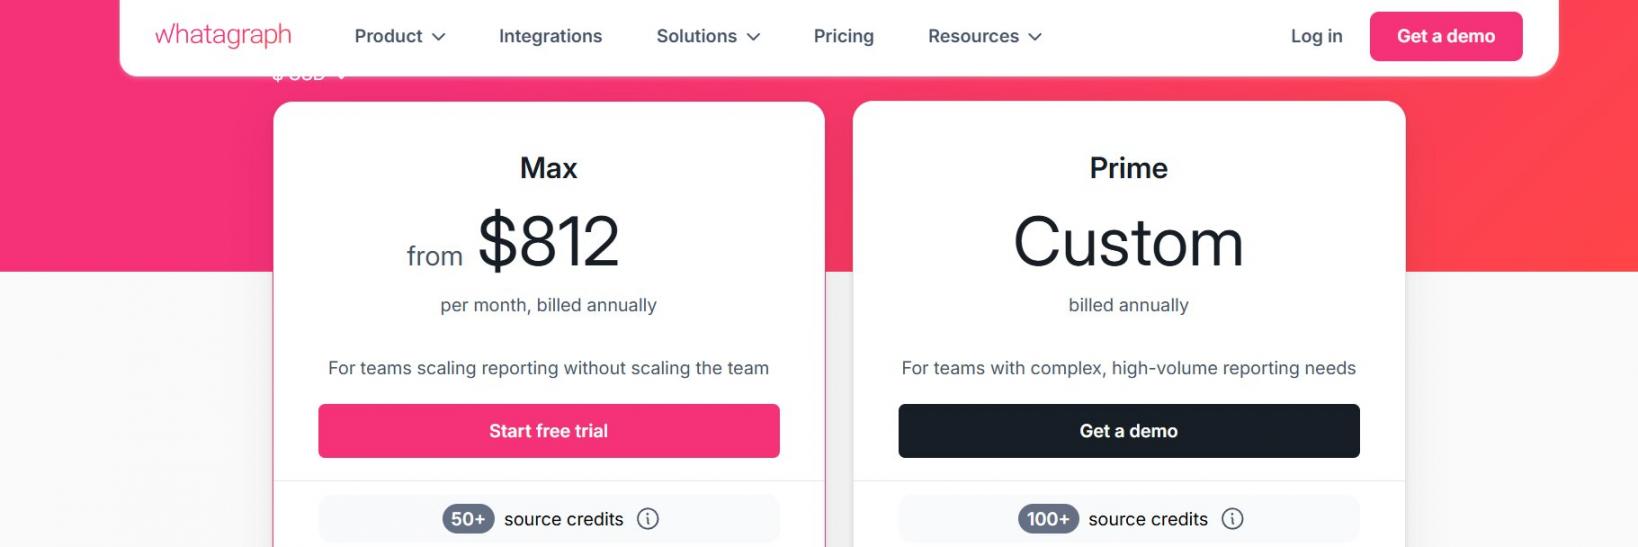
Image via Whatagraph
Tool Level
- Best for marketing agencies and in-house teams with regular reporting needs.
Usability
- User-Friendly & Template-Driven. Teams can usually produce well-crafted reports just a short while after getting acquainted with the system.
Pro Tip: Create a master template for each client, then duplicate it. The real benefit of Whatagraph is through recurring, scheduled reporting.
9. Tableau
Image via Tableau
Tableau is one of the most notable marketing analytics tools for brands seeking comprehensive business intelligence and data visualization. It’s one of the foremost platforms for analyzing large datasets.
It handles far more than just marketing data, making it the choice for enterprises that need advanced, blended analysis. It is best when your reporting outgrows lighter dashboard tools.
It blends massive, multi-source datasets into rich, interactive visualizations that lighter dashboard tools cannot match.
Key Features
- Creates rich, interactive dashboards
- Handles large and complex datasets
- Connects to databases, warehouses, and files
- Supports advanced calculations and data modeling
- Provides enterprise-grade security and access controls
Pros
- Best-in-class visualization and analytical depth.
- Handles large, blended datasets well.
- Strong governance for big organizations.
Cons
- Steeper learning curve than marketing dashboards.
- Per-seat pricing adds up across a team.
- Often needs a data analyst to run well.
Pricing
- Tablea Standard: $15
- Tableau Enterprise: $35
- Tableau Cloud+: Contact Sales
- Tableau+ Bundle: Contact Sales
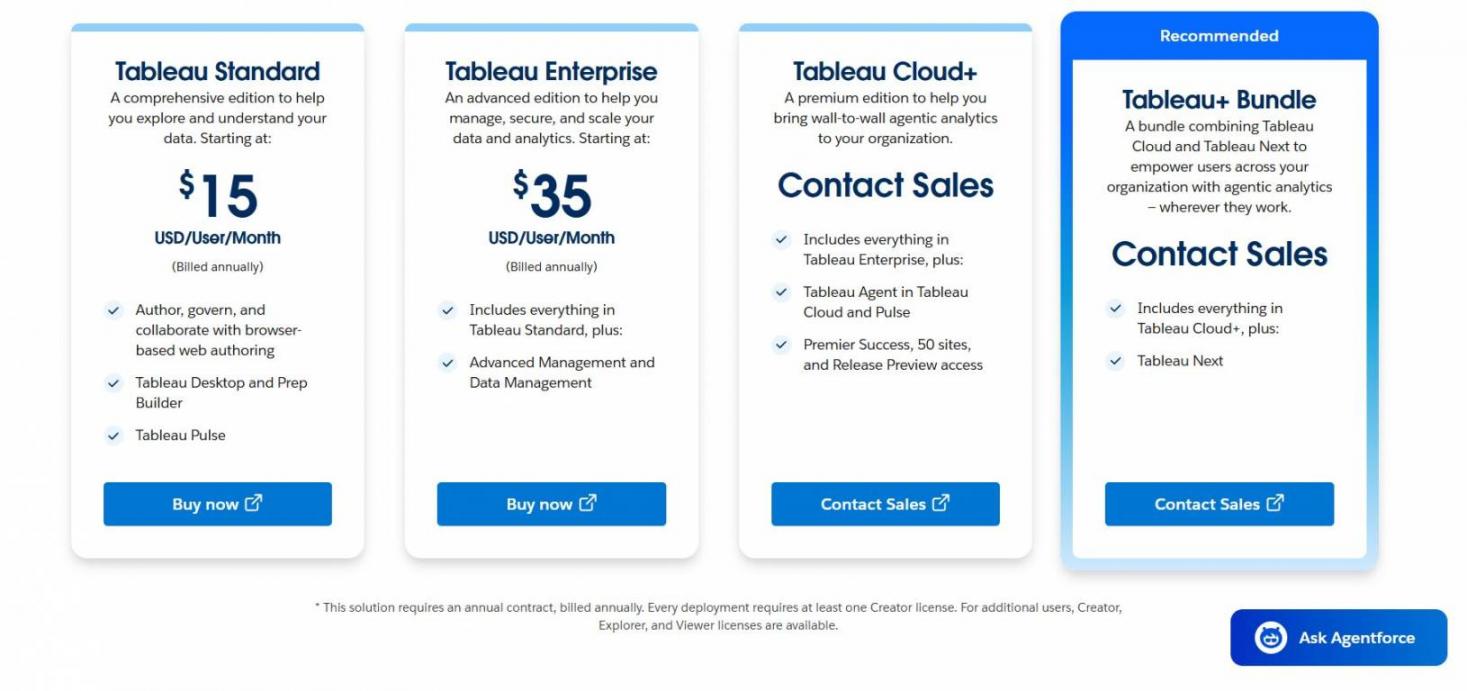
Image via Tableau
Tool Level
- Best for mid-market and enterprise teams with dedicated analysts.
Usability
- It's powerful but hard to learn. You will need to spend time training your team or buy a Creator seat for a data analyst to run it.
Pro Tip: Only buy Creator seats for the analysts who build the reports, and give Viewer seats to everyone else. This keeps your costs down while still letting everyone see the data.
What Are the Marketing Analytics Metrics and KPIs to Track?
The finest marketing analytics tools will only serve you well if you focus on the right core metrics. Keep an eye on those numbers that directly link expenditure to income, rather than superficial figures.
Begin by measuring those metrics that demonstrate ROI. Customer acquisition cost and return on ad spend will tell you whether your advertising expenditure is productive. The conversion rate of marketing-qualified leads to sales-qualified leads is a good indicator of the health of the sales pipeline. Customer lifetime value determines the maximum amount you can spend to acquire a customer.
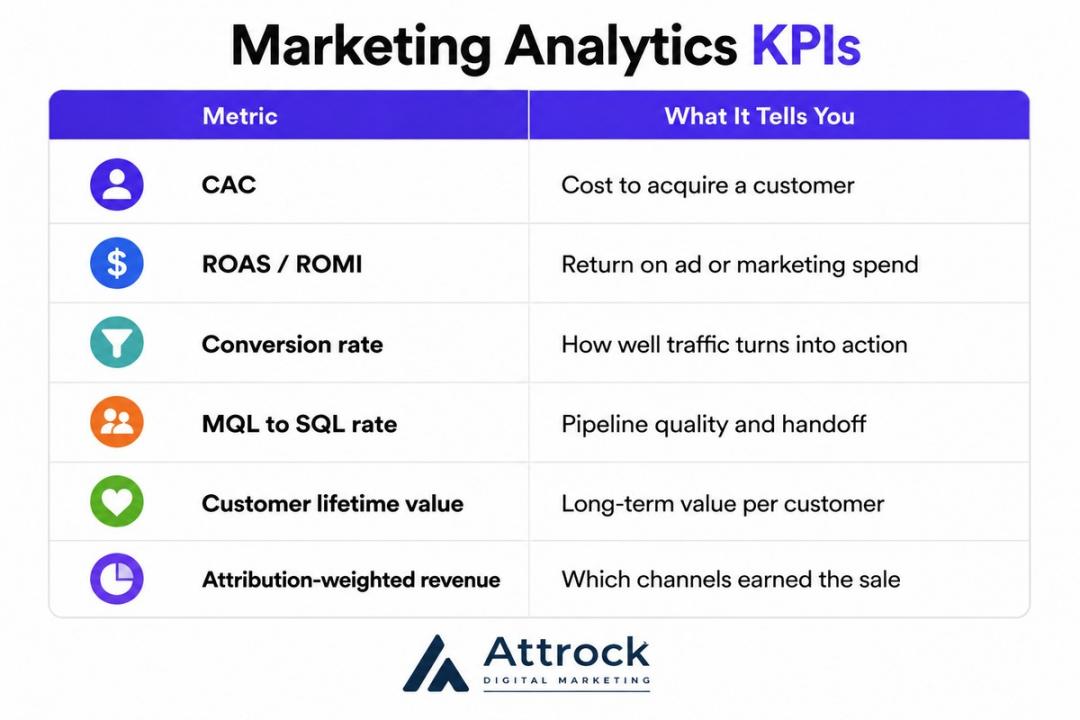
Image via Attrock
| Metric | What It Tells You | Where It Is Measured |
|---|---|---|
| CAC | Cost to acquire a customer | CRM plus ad platforms |
| ROAS / ROMI | Return on ad or marketing spend | Ad platforms, attribution tools |
| Conversion rate | How well traffic turns into action | Web and product analytics |
| MQL to SQL rate | Pipeline quality and handoff | CRM and marketing platform |
| Customer lifetime value | Long-term value per customer | CRM and revenue data |
| Attribution-weighted revenue | Which channels earned the sale | Attribution or all-in-one tools |
Attribution deserves special care. First-touch and last-touch models are simple but one-sided. Multi-touch attribution and marketing mix modeling give a fuller picture, though they need more data and a capable tool. For channel-level depth, see my guides on email marketing metrics and sales funnel metrics.
Track just a few key numbers that actually show how you make money, and check them regularly. A simple, focused report is much better than a massive dashboard with 50 charts that everyone ignores.
Data Privacy, Security, and Governance in Marketing Analytics
Privacy has changed from being a desirable product add-on to a deciding factor. Third-party cookies are being phased out, consent laws are being ramped up, and the tool you choose will affect your compliance. So, think of governance as a factor to consider when choosing marketing analytics tools, rather than a matter to check off afterwards.
Check where your data is stored and who controls it. With a self-hosted platform like Matomo, the data stays on your own servers. Cloud platforms store it for you, which is more convenient, but you should make sure it complies with the privacy laws in your region.
Also confirm that the vendor supports consent management and can delete user data when requested.
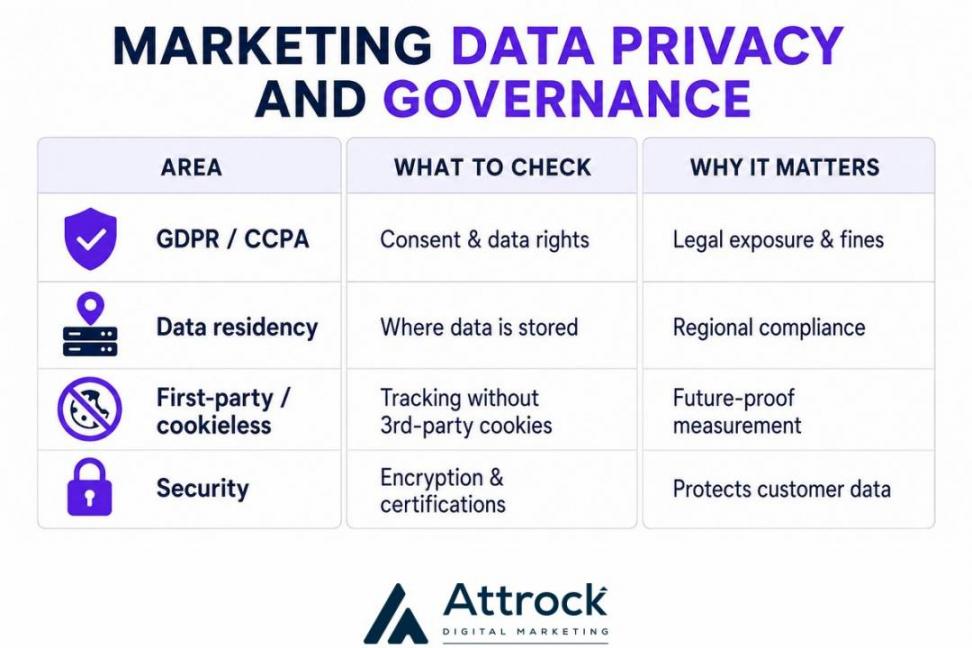
Image via Attrock
| Area | What to Check | Why it Matters |
|---|---|---|
| GDPR / CCPA | Consent handling and data subject rights | Legal exposure and fines |
| Data residency | Where data is stored | Regional compliance |
| First-party/cookieless | Tracking without third-party cookies | Future-proof measurement |
| Security | Encryption and certifications | Protects customer data |
Treat vendor security claims as claims until verified. Where a tool states a certification such as SOC 2 or ISO 27001, confirm it on the vendor's trust center before you rely on it.
Tools that break compliance rules are a danger to your business. Make sure the tool handles data ownership and user consent in a way that doesn’t violate your local laws.
AI and the Future of Marketing Analytics
AI is one of the biggest changes shaping marketing analytics in 2026. These tools are no longer limited to showing what happened. The best platforms now help marketers understand what to do next.
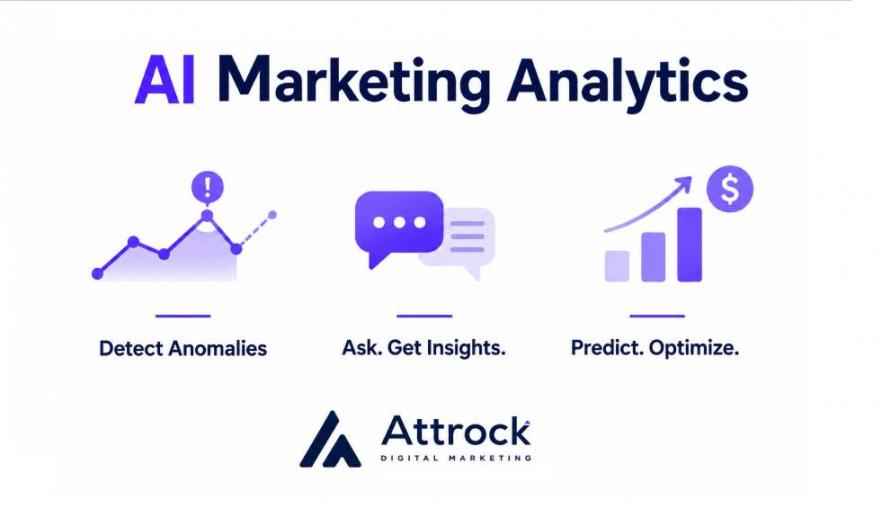
Image via Attrock
The shift is being driven by three main developments. Anomaly detection helps you catch problems in their early stages by automatically highlighting unusual spikes or drops.
Natural-language insights lower the skill barrier by letting you ask questions and receive answers in plain English. On their part, predictive and prescriptive analytics can forecast outcomes and suggest budget shifts.
Attribution is also becoming more intelligent. The addition of InfiniGrow to Amplitude's platform in 2026 brought AI-powered revenue attribution to the fold, and other major vendors are moving in the same direction. The result is marketing analytics tools that can attach marketing touchpoints to revenue without requiring extensive manual modeling.
Yet, it’s important to remain cautious. AI features are only as reliable as the data on which they operate. Only accurate, properly managed data can turn forecasting into a useful activity instead of merely an act of faith.
Favor marketing analytics tools that invest in AI you will actually use, like anomaly alerts and natural-language queries. Skip features that look impressive in a demo but never enter your workflow.
What Are the Marketing Analytics Tool Terms to Note?
Attribution, marketing mix modeling, and business intelligence are some of the most important marketing analytics terms to know. A few terms come up across every tool. Here is the straightforward version.
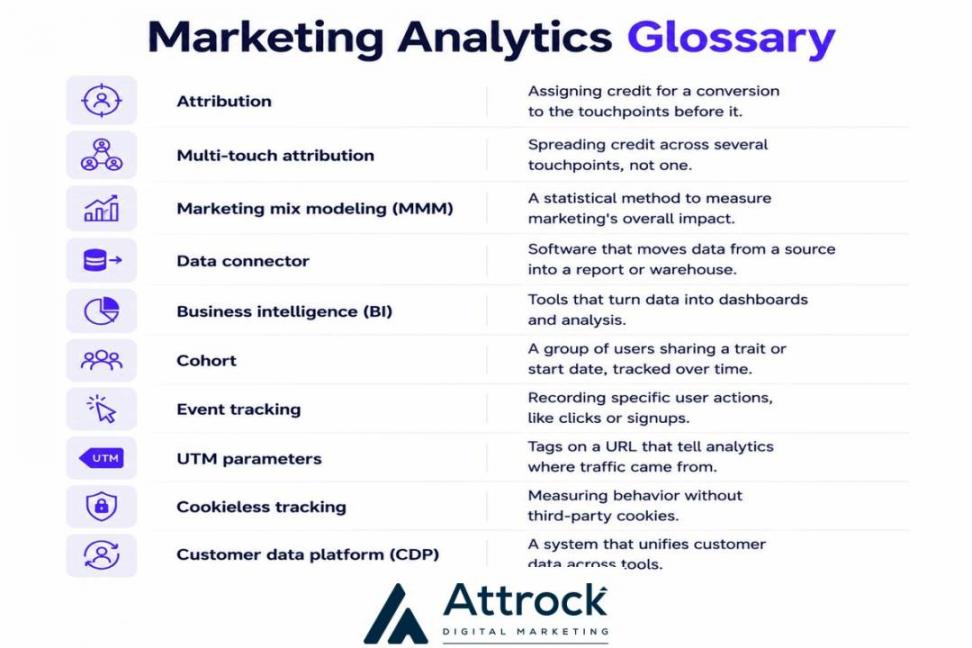
Image via Attrock
- Attribution: Assigning credit for a conversion to the touchpoints before it.
- Multi-Touch Attribution: Spreading credit across several touchpoints, not one.
- Marketing Mix Modeling (MMM): A statistical method to measure marketing's overall impact.
- Data Connector: Software that moves data from a source into a report or warehouse.
- Business Intelligence (BI): Tools that turn data into dashboards and analysis.
- Cohort: A group of users sharing a trait or start date, tracked over time.
- Event Tracking: Recording specific user actions, like clicks or signups.
- UTM Parameters: Tags on a URL that tell analytics where traffic came from.
- Cookieless Tracking: Measuring behavior without third-party cookies.
- Customer Data Platform (CDP): A system that unifies customer data across tools.
Before you commit, run this quick checklist:
- Does it connect to my main data sources natively?
- Can it build the reports my stakeholders need?
- Does it offer the attribution depth I require?
- Is the pricing clear at my expected scale?
- Does it meet my privacy and governance needs?
- How long until my team is productive in it?
- Can I export my data and leave cleanly?
If a marketing analytics tool clears this checklist for your biggest measurement gap, it belongs on your shortlist.
FAQ
Q1. What is marketing analytics in simple words?
A. Marketing analytics is the process of collecting and analyzing your marketing data to gauge your performance and make better marketing decisions. Simply put, it helps you figure out what's working, what's not, and where to invest next. In other words, it helps you rely on data to make decisions rather than on guesses.
Q2. What are marketing analytics tools?
A. Marketing analytics tools refer to programs and platforms that collect information from your marketing activities, bring them together, and produce visual data such as reports and dashboards. In a nutshell, they let you monitor your marketing efforts, calculate your returns, and get a grasp of your customers across online advertising, email, social media, and your CRM, all in one place.
Q3. What are the 4 types of marketing analytics?
A. The four types of marketing analytics are descriptive, diagnostic, predictive, and prescriptive. Marketing teams typically begin with descriptive and diagnostic analytics before adding predictive and prescriptive analytics as their data capabilities grow.
Q4. What is an example of marketing analytics?
A. Multi-touch attribution is a common example. It details the series of channels and campaigns a customer interacted with before making the purchase, and then it assigns revenue credit across them. So, for example, it might reveal that paid search was the channel that initially attracted the customer and email was the channel that actually closed the sale, leading to proper funding of both channels.
Q5. Which software is best for marketing metrics analysis?
A. The choice depends on what you want to do. If you want a tool that does analysis, marketing automation, and CRM all in one, go with the HubSpot Marketing Hub. If you need web metrics and don't want to spend money, Google Analytics 4 is your best bet. If you want to create detailed visualizations, go with Tableau. Most teams use a combination of a tracker, a reporting tool, and sometimes a connector.
Q6. What are the best free marketing analytics tools?
A. To mention just a few, Google Analytics 4 is the hardest-hitting free tool for web tracking, Looker Studio you can use for dashboards, and if you go the self-hosted route, then Matomo is an excellent choice. They complement each other very well. You get tracking with Google Analytics 4, reporting with Looker Studio, and privacy-friendly analytics with Matomo, all without paying for a license.
Q7. What is the difference between web analytics and marketing analytics?
A. Web analytics involves measuring activities happening on your website, like traffic and user behavior. Marketing analytics, on the other hand, is broader. It measures performance across all channels, including ads, email, social media, and your CRM.
Q8. How many marketing analytics tools do I need?
A. The average team can work with three to six marketing analytics tools. Essential tools include a web tracker, a reporting or dashboard platform, and a data connector. Teams in the software business may need to add a product analytics tool to this list. The right number depends on your channels and team size.
Q9. What is the best marketing analytics tool for small businesses?
A. A free stack of Google Analytics 4 plus Looker Studio is the best choice for a small business. You may also opt for HubSpot Marketing Hub if you want analytics and a CRM together. It’s wise to start with free tools and introduce paid ones only when a clear reporting gap has been identified.
Final Thoughts
Each one of the best marketing analytics tools essentially tells you the same thing, just in various ways: which marketing is really generating the most revenue. HubSpot Marketing Hub is the best choice for comprehensive all-in-one teams.
Google Analytics 4 and Looker Studio make a powerful free combination, while Mixpanel, Amplitude, Matomo, Supermetrics, Whatagraph, and Tableau each have their own distinct use cases. First, base your decision on the largest measurement gap in your business, and gradually build a stack as your business needs change.
If you want help turning analytics into action, my team at Attrock builds highly effective data-driven conversion optimization programs.
Are you looking for an all-in-one solution for your marketing analytics needs? Try HubSpot's marketing analytics here.
Disclaimer: This content contains some affiliate links for which we will earn a commission (at no additional cost to you). This is to ensure that we can keep creating free content for you.